


Research Methodology - Statistical Analysis
TESTING OF HYPOTHESIS - Statistical Analysis
Posted On :
The test of significance for the large samples can be explained by the following assumptions:
TESTING OF HYPOTHESIS
The test of significance for the large samples can be explained by the following assumptions:
1. The random sampling distribution of statistics is approximately normal.
2. Sampling values are sufficiently close to the population value and can be used for the calculation of standard error of estimate.
In the case of large samples, when we are testing the significance of statistic, the concept of standard error is used. It measures only sampling errors. Sampling errors are involved in estimating a population parameter from a sample, instead of including all the essential information in the population.
when standard deviation of the population is known, the formula is
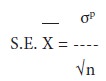
Where,

 The standard error of the mean, σp = Standard deviation of the
population, and n = Number of observations in the sample.
The standard error of the mean, σp = Standard deviation of the
population, and n = Number of observations in the sample.
(ii) when standard deviation of population is not known, we have to use the standard deviation of the sample in calculating standard error of mean.
The formula is
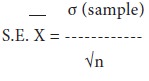
Where,
σ = Standard deviation of the sample, and n = Sample size
Illustration:
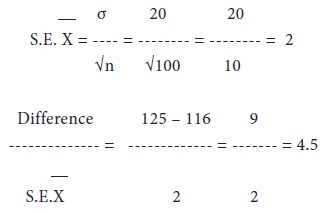
A sample of 100 students from Pondicherry University was taken and their average was found to be 116 lbs with a standard deviation of 20 lbs. Could the mean weight of students in the population be 125 pounds?
Solution:
Since, the difference is more than 2.58 S.E.(1% level) it could not have arisen due to fluctuations of sampling. Hence the mean weight of students in the population could not be 125 lbs.
If the sample size is less than 30, then those samples may be regarded as small samples. As a rule, the methods and the theory of large samples are not applicable to the small samples. The small samples are used in testing a given hypothesis, to find out the observed values, which could have arisen by sampling fluctuations from some values given in advance. In a small sample, the investigator’s estimate will vary widely from sample to sample. An inference drawn from a smaller sample result is less precise than the inference drawn from a large sample result.
t-distribution will be employed, when the sample size is 30 or less and the population standard deviation is unknown.
The formula is
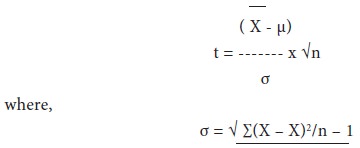
Illustration:
The following results are obtained from a sample of 20 boxes of mangoes:
Mean weight of contents = 490gms,
Standard deviation of the weight = 9 gms.
Could the sample come from a population having a mean of 500 gms?
Solution:
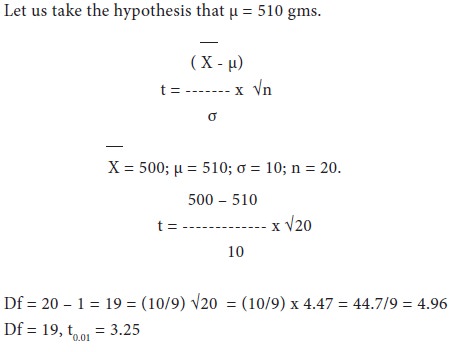
The computed value is less than the table value. Hence, our null hypothesis is accepted.
Test of Significance for Large Samples
The test of significance for the large samples can be explained by the following assumptions:
1. The random sampling distribution of statistics is approximately normal.
2. Sampling values are sufficiently close to the population value and can be used for the calculation of standard error of estimate.
The Standard Error Of Mean.
In the case of large samples, when we are testing the significance of statistic, the concept of standard error is used. It measures only sampling errors. Sampling errors are involved in estimating a population parameter from a sample, instead of including all the essential information in the population.
when standard deviation of the population is known, the formula is
Where,
The standard error of the mean, σp = Standard deviation of the
population, and n = Number of observations in the sample.(ii) when standard deviation of population is not known, we have to use the standard deviation of the sample in calculating standard error of mean.
The formula is
Where,
σ = Standard deviation of the sample, and n = Sample size
Illustration:
A sample of 100 students from Pondicherry University was taken and their average was found to be 116 lbs with a standard deviation of 20 lbs. Could the mean weight of students in the population be 125 pounds?
Solution:
Let
us take the hypothesis that there is no significant difference between the
sample mean and the hypothetical population mean.
Since, the difference is more than 2.58 S.E.(1% level) it could not have arisen due to fluctuations of sampling. Hence the mean weight of students in the population could not be 125 lbs.
Test Of Significance For Small Samples
If the sample size is less than 30, then those samples may be regarded as small samples. As a rule, the methods and the theory of large samples are not applicable to the small samples. The small samples are used in testing a given hypothesis, to find out the observed values, which could have arisen by sampling fluctuations from some values given in advance. In a small sample, the investigator’s estimate will vary widely from sample to sample. An inference drawn from a smaller sample result is less precise than the inference drawn from a large sample result.
t-distribution will be employed, when the sample size is 30 or less and the population standard deviation is unknown.
The formula is
Illustration:
The following results are obtained from a sample of 20 boxes of mangoes:
Mean weight of contents = 490gms,
Standard deviation of the weight = 9 gms.
Could the sample come from a population having a mean of 500 gms?
Solution:
The computed value is less than the table value. Hence, our null hypothesis is accepted.
Tags : Research Methodology - Statistical Analysis
Last 30 days 1147 views