Home | ARTS | Accounting For Managers
|
Construction Of Break-Even Chart-Cost Volume Profit Analysis
Accounting For Managers - Management Accounting-Cost Volume Profit Analysis
Construction Of Break-Even Chart-Cost Volume Profit Analysis
Posted On :

The following steps are required to be taken while constructing the Break-even chart:
Construction Of Break-Even Chart
The following steps are required to be taken while constructing the Break-even chart:
1. Sales volume is plotted on the x-axis. Sales volume can be shown in the form of rupees, units or as a percentage of capacity. A horizontal line is drawn spacing equal distances showing sales at various activity levels.

Illustration 9:
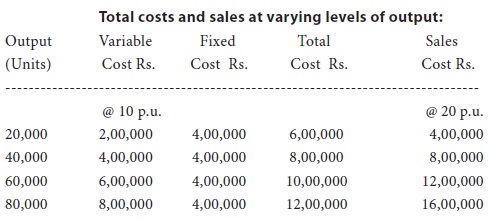
from the following information, prepare a break-even chart

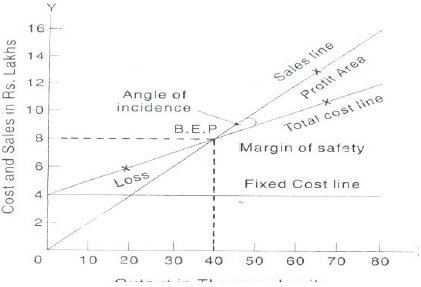
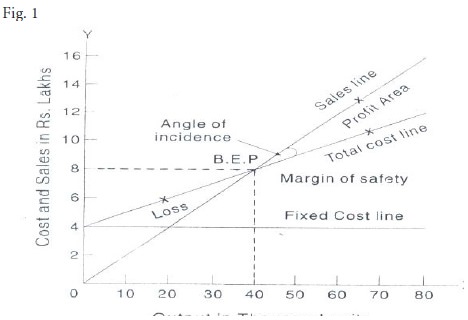
First Method (Fig.1)
Fixed cost line runs parallel to x-axis. Total cost line is drawn at rs.4 lakhs on y-axis and runs upward. Sales line drawn from point o.
B.E.P. is at 40,000 units, i.e., rs.8,00,000
M/S = Sales – B.E. Volume
= 80,000 – 40,000
= 40,000 Units (I.E. Rs.8,00,000)
Alternative Method (Fig.2)
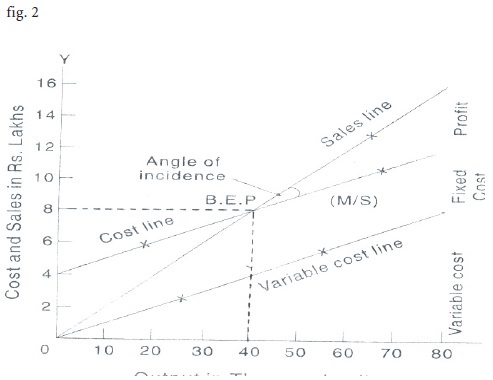
Variable cost line starts from point o and runs upward. Total cost Line is drawn parallel to v.c.line from rs.4 lakhs point on y-axis. Total Cost and sales line cut each other at 40,000 units (i.e., rs.8,00,000 sales). This is the break-even point.
This chart is prepared to show the cash need of a concern. Fixed expenses are to be classified as those involving cash payments and those not involving cash payments like depreciation. As the cash break-even chart is designed to include only actual payments and not expenses incurred, any time lag in the payment of items included under variable costs must be taken into account. Equal care must be shown on the period of credit allowed to the debtors for the purpose of calculating the amount of cash to be received from them, during a particular period.
Illustration 10:
The following information is available in respect of graphics ltd., ghaziabad, for the budget period.
Sales 10,000 units at rs.10 per unit.
Variable costs rs.4 per unit.
Fixed costs rs.25,000 including depreciation of rs.5,000
Preference dividend to be paid rs.5,000
Taxes to be paid rs.5,000
The following steps are required to be taken while constructing the Break-even chart:
1. Sales volume is plotted on the x-axis. Sales volume can be shown in the form of rupees, units or as a percentage of capacity. A horizontal line is drawn spacing equal distances showing sales at various activity levels.
2. Y axis represents revenues, fixed and variable costs. A vertical line is also spaced in equal parts.
3. Draw the sales line from point o onwards. Cost lines may be drawn in two ways (i) fixed cost line is drawn parallel to x axis and above it variable cost line is drawn from zero point of fixed cost line. This line is called the total cost line (fig.1) (ii) in the second method the variable cost line is drawn from point o and above this, fixed cost line is depicted running parallel to the variable cost line. This line may be called total cost line. (fig.2)
4. The point at which the total cost cuts across the sales line is the break-even point and volume at this point is break-even volume.
5. The angle of incidence is the angle between sales and the total cost line. It is formed at the intersection of the sales and the total cost line, indicating the profit earning capacity of a firm. The wider the angle the greater is the profit and vice versa. Usually, the angle of incidence and the margin of safety are considered together to show that a wider angle of incidence coupled with a high margin of safety would indicate the most suitable conditions.


Illustration 9:
from the following information, prepare a break-even chart
Showing the break-even point. | ||||||
Budget output | …. | 80,000 units | ||||
Fixed expenses | …. | Rs.4,00,000 | ||||
Selling price per unit .…. | Rs. | 20 | ||||
Variable cost per unit …. | Rs. | 10 | ||||
Solution: | ||||||

First Method (Fig.1)
Fixed cost line runs parallel to x-axis. Total cost line is drawn at rs.4 lakhs on y-axis and runs upward. Sales line drawn from point o.
B.E.P. is at 40,000 units, i.e., rs.8,00,000
M/S = Sales – B.E. Volume
= 80,000 – 40,000
= 40,000 Units (I.E. Rs.8,00,000)
Alternative Method (Fig.2)
Variable cost line starts from point o and runs upward. Total cost Line is drawn parallel to v.c.line from rs.4 lakhs point on y-axis. Total Cost and sales line cut each other at 40,000 units (i.e., rs.8,00,000 sales). This is the break-even point.
Cash Break-Even Chart
This chart is prepared to show the cash need of a concern. Fixed expenses are to be classified as those involving cash payments and those not involving cash payments like depreciation. As the cash break-even chart is designed to include only actual payments and not expenses incurred, any time lag in the payment of items included under variable costs must be taken into account. Equal care must be shown on the period of credit allowed to the debtors for the purpose of calculating the amount of cash to be received from them, during a particular period.
Illustration 10:
The following information is available in respect of graphics ltd., ghaziabad, for the budget period.
Sales 10,000 units at rs.10 per unit.
Variable costs rs.4 per unit.
Fixed costs rs.25,000 including depreciation of rs.5,000
Preference dividend to be paid rs.5,000
Taxes to be paid rs.5,000
It may be assumed that there are no lags in payment. Prepare a cash break-even chart.
Tags : Accounting For Managers - Management Accounting-Cost Volume Profit Analysis
Last 30 days 1345 views


