Accounting For Managers - Management Accounting-Cost Volume Profit Analysis
Application Of Cost-Volume-Profit Analysis
Posted On :
Application Of Cost-Volume-Profit Analysis
Application Of Cost-Volume-Profit Analysis
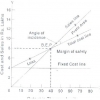
CPV analysis helps in:
ՖՖ Forecasting the profit in an accurate manner
ՖՖ Preparing the flexible budgets at different levels of activity
ՖՖ Fixing prices for products
(Profit Planning) based on the following information, find out the break even point, the sales needed for a profit of rs.6,00,000 and the profit if 4,00,000 units are sold at rs.6 per unit.
Units Of Output 5,00,000
Fixed Costs Rs.7,50,000
Variable Cost Per Unit Rs. 2
Selling Price Per Unit Rs. 5
A company is considering a reduction in the price of its product by 10% because it is felt that such a step may lead to a greater volume of sales. It is anticipated that there will be no change in total fixed costs or variable costs per unit. The directors wish to maintain profit at the present level.
You are
given the following information:
From the above information, calculate P/V ratio and the amount of sales required to maintain profit at the present level after reduction of selling price by 10%.
From the following data, calculate the break-even point.
First year Second Year
Sales 80,000 90,000
Profit Rs.10,000 Rs.14,000
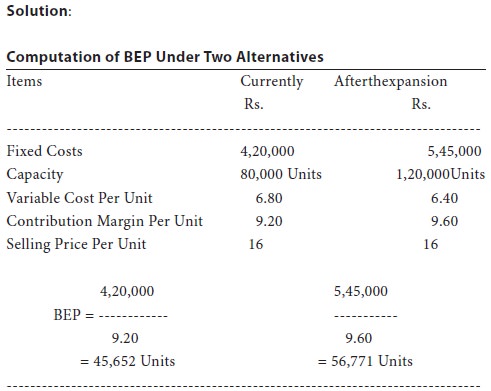
A company is considering expansion. Fixed costs amount to rs.4,20,000 and are expected to increase by rs.1,25,000 when plant expansion is completed. The present plant capacity is 80,000 units a year. Capacity will increase by 50 percent with the expansion. Variable costs are currently rs.6.80 per unit and are expected to go down by re.0.40 per unit with the expansion. The current selling price is rs.16 per unit and is expected to remain the same under either alternative. What are the break-even points under either alternatives? Which alternative is better and why?
Assuming that the whole production can be sold, the profit under
The two alternatives will be:
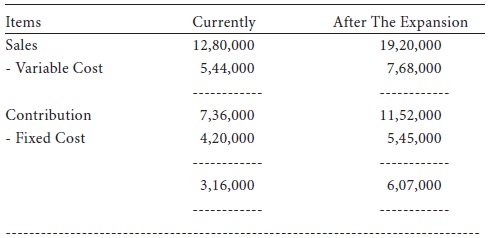
It is obvious from the above calculations that the profits will be almost double after the expansion. Hence, the alternative of expansion is to be preferred.
A factory engaged in manufacturing plastic buckets is working at 40% capacity and produces 10,000 buckets per annum:
The selling price is rs.20 per bucket.
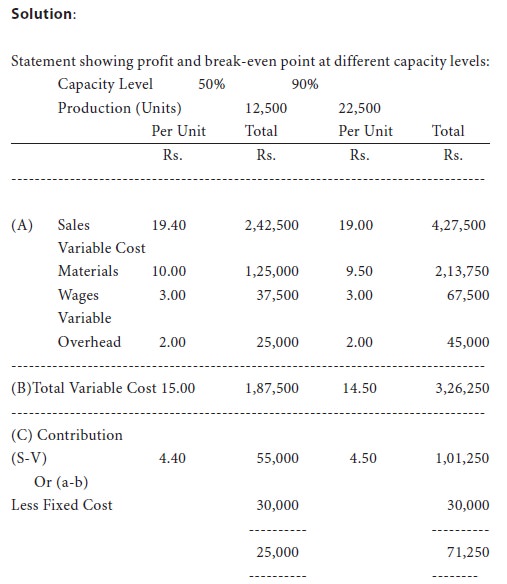
If it is decided to work the factory at 50% capacity, the selling price falls by 3%. At 90% capacity the selling price falls by 5%, accompanied by a similar fall in the prices of material.
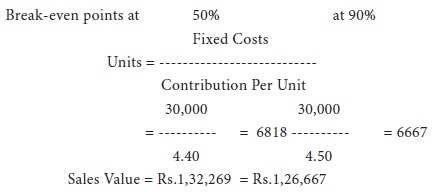
You are required to calculate the profit at 50% and 90% capacities and also the break-even points for the same capacity productions.
Calculate:
ՖՖ The amount of fixed expenses
ՖՖ The number of units to break-even
ՖՖThe number of units to earn a profit of rs.40,000 The selling price can be assumed as rs.10.
The company sold in two successive periods 9,000 units and 7,000 units and has incurred a loss of rs.10,000 and earned rs.10,000 as profit respectively.
From The Following Data Calculate:
ՖՖ P/V Ratio
ՖՖ Profit When Sales Are Rs.20,000
ՖՖ Net Break-Even If Selling Price Is Reduced By 20%
From the following data calculate:
ՖՖ Break-even point in amount of sales in rupees.
ՖՖ Number of units that must be sold to earn a profit of Rs.60,000 Per year.
ՖՖ How many units must be sold to earn a net profit of 15% of sales?
Sales Price Rs.20 Per Unit
Variable manufacturing costs Rs.11 per unit
Variable selling costs Rs. 3 per unit
Fixed factory overheads Rs.5,40,000
Fixed selling costs Rs.2,52,000
CPV analysis helps in:
ՖՖ Forecasting the profit in an accurate manner
ՖՖ Preparing the flexible budgets at different levels of activity
ՖՖ Fixing prices for products
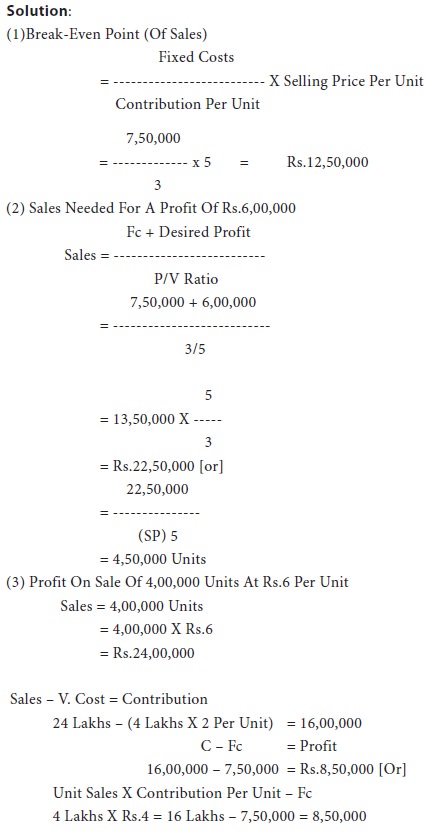
Illustration 1:
(Profit Planning) based on the following information, find out the break even point, the sales needed for a profit of rs.6,00,000 and the profit if 4,00,000 units are sold at rs.6 per unit.
Units Of Output 5,00,000
Fixed Costs Rs.7,50,000
Variable Cost Per Unit Rs. 2
Selling Price Per Unit Rs. 5
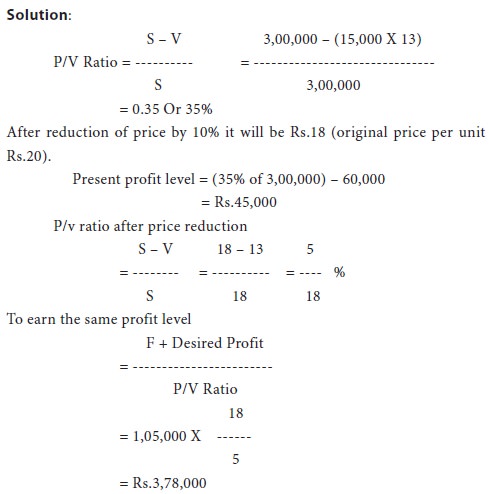
Illustration 2: (Pricing)
A company is considering a reduction in the price of its product by 10% because it is felt that such a step may lead to a greater volume of sales. It is anticipated that there will be no change in total fixed costs or variable costs per unit. The directors wish to maintain profit at the present level.
Sales
(15,000 Units) | Rs.3,00,000 |
Variable
Cost | Rs.13 Per Unit |
Fixed
Cost | Rs.60,000 |
From the above information, calculate P/V ratio and the amount of sales required to maintain profit at the present level after reduction of selling price by 10%.
Illustration 3:
From the following data, calculate the break-even point.
First year Second Year
Sales 80,000 90,000
Profit Rs.10,000 Rs.14,000
Illustration 4:
A company is considering expansion. Fixed costs amount to rs.4,20,000 and are expected to increase by rs.1,25,000 when plant expansion is completed. The present plant capacity is 80,000 units a year. Capacity will increase by 50 percent with the expansion. Variable costs are currently rs.6.80 per unit and are expected to go down by re.0.40 per unit with the expansion. The current selling price is rs.16 per unit and is expected to remain the same under either alternative. What are the break-even points under either alternatives? Which alternative is better and why?
Assuming that the whole production can be sold, the profit under
The two alternatives will be:
It is obvious from the above calculations that the profits will be almost double after the expansion. Hence, the alternative of expansion is to be preferred.
Illustration 5:
A factory engaged in manufacturing plastic buckets is working at 40% capacity and produces 10,000 buckets per annum:
Rs. | ||
Material | 10 | |
Labour
cost | 3 | |
Overheads | 5 | (60% fixed) |
The selling price is rs.20 per bucket.
If it is decided to work the factory at 50% capacity, the selling price falls by 3%. At 90% capacity the selling price falls by 5%, accompanied by a similar fall in the prices of material.
You are required to calculate the profit at 50% and 90% capacities and also the break-even points for the same capacity productions.
Illustration 6:
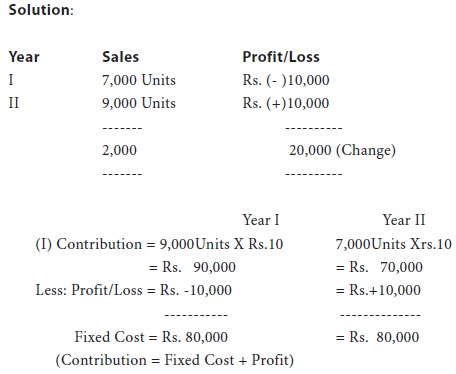
Calculate:
ՖՖ The amount of fixed expenses
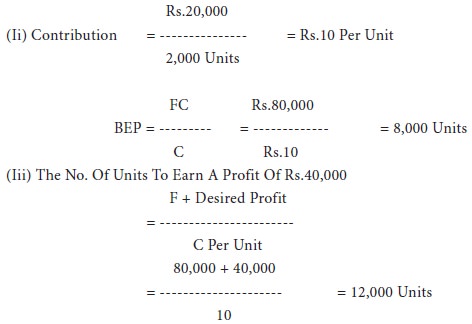
ՖՖ The number of units to break-even
ՖՖThe number of units to earn a profit of rs.40,000 The selling price can be assumed as rs.10.
The company sold in two successive periods 9,000 units and 7,000 units and has incurred a loss of rs.10,000 and earned rs.10,000 as profit respectively.
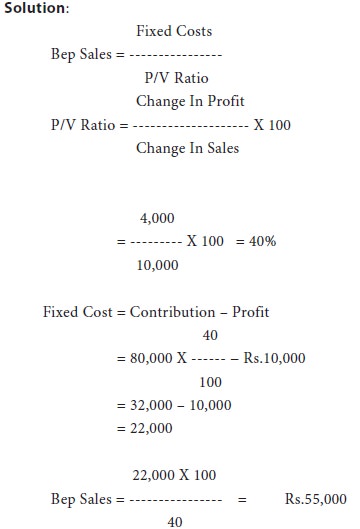
Illustration 7:
From The Following Data Calculate:
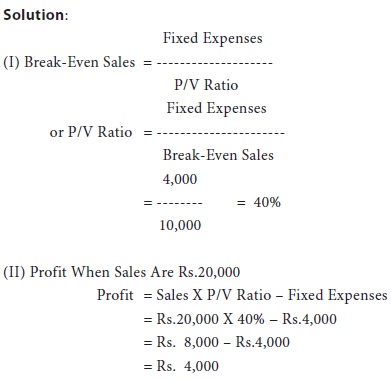
ՖՖ P/V Ratio
ՖՖ Profit When Sales Are Rs.20,000
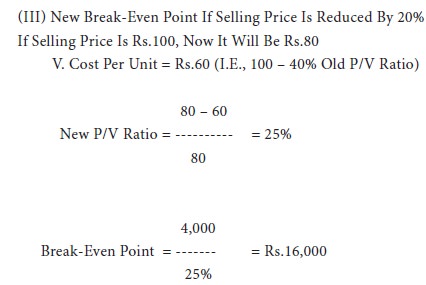
ՖՖ Net Break-Even If Selling Price Is Reduced By 20%
Fixed Expenses Rs.4,000
Break-Even Point 10,000
Break-Even Point 10,000
Illustration 8:
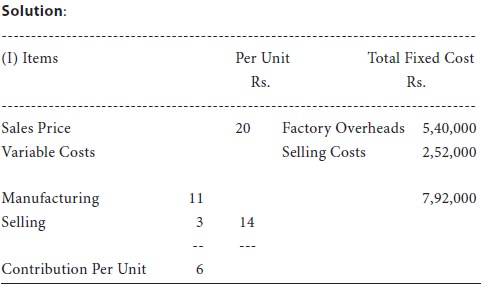
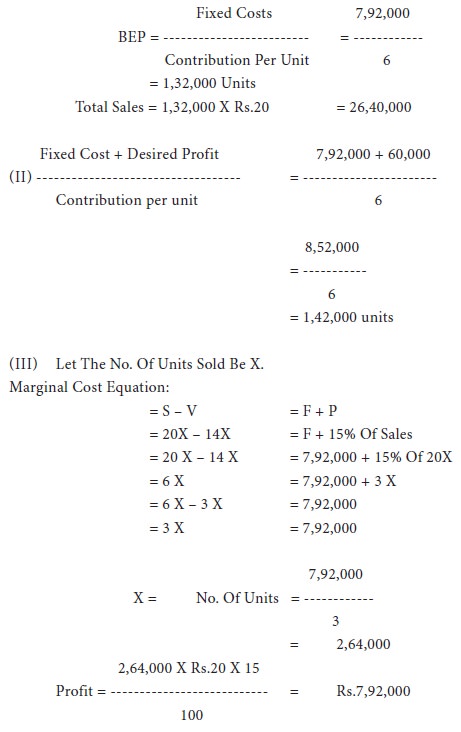
From the following data calculate:
ՖՖ Break-even point in amount of sales in rupees.
ՖՖ Number of units that must be sold to earn a profit of Rs.60,000 Per year.
ՖՖ How many units must be sold to earn a net profit of 15% of sales?
Sales Price Rs.20 Per Unit
Variable manufacturing costs Rs.11 per unit
Variable selling costs Rs. 3 per unit
Fixed factory overheads Rs.5,40,000
Fixed selling costs Rs.2,52,000
Tags : Accounting For Managers - Management Accounting-Cost Volume Profit Analysis
Last 30 days 2610 views