Accounting For Managers - Management Accounting-Cost Volume Profit Analysis
Break-Even Chart-Cost Volume Profit Analysis
Posted On :
The break-even point can also be shown graphically through the break-even chart.
Break-Even
Chart
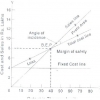
The break-even point can also be shown graphically through the break-even chart. The break-even chart `shows the profitability or otherwise of an undertaking at various levels of activity and as a result indicates the point at which neither profit nor loss is made’. It shows the relationship, through a graph, between cost, volume and profit. The break- even point lies at the point of intersection between the total cost line and the total sales line in the chart. In order to construct the breakeven chart, the following assumptions are made:
1. Fixed costs will remain constant and do not change with the level of activity.
The break-even point can also be shown graphically through the break-even chart. The break-even chart `shows the profitability or otherwise of an undertaking at various levels of activity and as a result indicates the point at which neither profit nor loss is made’. It shows the relationship, through a graph, between cost, volume and profit. The break- even point lies at the point of intersection between the total cost line and the total sales line in the chart. In order to construct the breakeven chart, the following assumptions are made:
Assumptions Of Break-Even Chart
1. Fixed costs will remain constant and do not change with the level of activity.
2.
Costs are bifurcated into fixed
and variable costs. Variable costs change according to the volume of
production.
3.
Prices of variable cost factors
(wage rates, price of materials, suppliers etc.) Will remain unchanged so that
variable costs are truly variable.
4.
Product specifications and
methods of manufacturing and selling will not undergo a change.
5. Operating
efficiency will not increase or decrease.
6. Selling price remains the same at different levels of activity.
7. Product mix will remain unchanged.
8. The number of units of sales will coincide with the units produced, and hence, there is no closing or opening stock.
6. Selling price remains the same at different levels of activity.
7. Product mix will remain unchanged.
8. The number of units of sales will coincide with the units produced, and hence, there is no closing or opening stock.
Tags : Accounting For Managers - Management Accounting-Cost Volume Profit Analysis
Last 30 days 647 views