


Research Methodology - Statistical Analysis
The Chi-Square Distribution - Statistical Analysis
Posted On :
For large sample sizes, the sampling distribution of χ2 can be closely approximated by a continuous curve known as the Chi-square distribution.
The
Chi-Square Distribution
For large sample sizes, the sampling distribution of χ2 can be closely approximated by a continuous curve known as the Chi-square distribution. The probability function of χ2 distribution is:
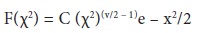
Where
e = 2.71828, v = number of degrees of freedom, C = a constant depending only on v.
The χ2 distribution has only one parameter, v, the number of degrees of freedom. As in case of t-distribution there is a distribution for each different number of degrees of freedom. For very small number of degrees of freedom, the Chi-square distribution is severely skewed to the right. As the number of degrees of freedom increases, the curve rapidly becomes more symmetrical. For large values of v the Chi-square distribution is closely approximated by the normal curve.
Illustration:
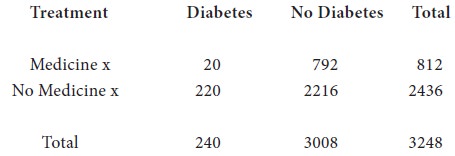
In an anti-diabetes campaign in a certain area, a particular medicine, say x was administered to 812 persons out of a total population of 3248. The number of diabetes cases is shown below:
Calculate χ2 and discuss the effect of vaccine in controlling susceptibility to tuberculosis (5% value of χ2 for one degree of freedom = 3.84).
Solution:
Let us take the hypothesis that the vaccine is not effective in controlling susceptibility to tuberculosis. Applying χ2 test:
For large sample sizes, the sampling distribution of χ2 can be closely approximated by a continuous curve known as the Chi-square distribution. The probability function of χ2 distribution is:
Where
e = 2.71828, v = number of degrees of freedom, C = a constant depending only on v.
The χ2 distribution has only one parameter, v, the number of degrees of freedom. As in case of t-distribution there is a distribution for each different number of degrees of freedom. For very small number of degrees of freedom, the Chi-square distribution is severely skewed to the right. As the number of degrees of freedom increases, the curve rapidly becomes more symmetrical. For large values of v the Chi-square distribution is closely approximated by the normal curve.
The following diagram gives χ2
distribution for 1, 5 and 10 degrees of freedom:
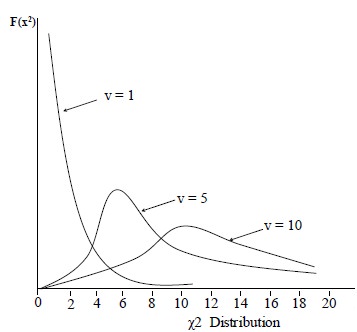
It is clear from the given diagram that as the degrees of freedom increase, the curve becomes more and more symmetric. The Chi-square distribution is a probability distribution and the total area under the curve in each Chi-square distribution is unity.
The main properties of χ2 distribution are:-
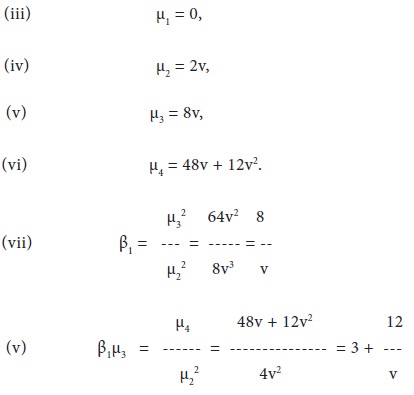
i. . The mean of the χ2 distribution is equal to the number of degrees of freedom,
ii. The variance of the χ2 distribution is twice the degrees of freedom, Variance = 2v
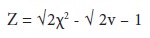
The table values of χ2 are available only up to 30 degrees of freedom. For degrees of freedom greater than 30, the distribution of χ2 approximates the normal distribution. For degrees of freedom greater than 30, the approximation is acceptable close. The mean of the distribution √2χ2 is √2v – 1, and the standard deviation is equal to 1. Thus the application of the test is simple, for deviation of √2χ2 from √2v – 1 may be interpreted as a normal deviate with units standard deviation. That is,
Alternative Method Of Obtaining The Value of χ2
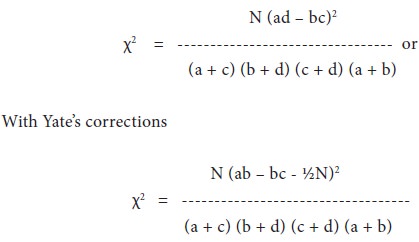
In a 2x2 table where the cell frequencies and marginal totals are as below:
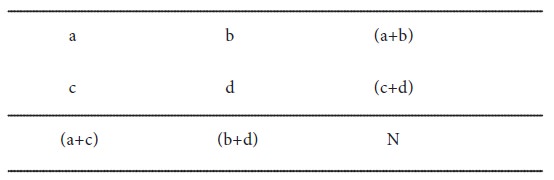
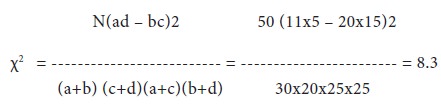
N is the total frequency and ad the larger cross-product, the value of χ2 can easily be obtained by the following formula:
The main conditions considered for employing the χ2 test are:
It is clear from the given diagram that as the degrees of freedom increase, the curve becomes more and more symmetric. The Chi-square distribution is a probability distribution and the total area under the curve in each Chi-square distribution is unity.
Properties of χ2 Distribution
The main properties of χ2 distribution are:-
i. . The mean of the χ2 distribution is equal to the number of degrees of freedom,
ii. The variance of the χ2 distribution is twice the degrees of freedom, Variance = 2v
The table values of χ2 are available only up to 30 degrees of freedom. For degrees of freedom greater than 30, the distribution of χ2 approximates the normal distribution. For degrees of freedom greater than 30, the approximation is acceptable close. The mean of the distribution √2χ2 is √2v – 1, and the standard deviation is equal to 1. Thus the application of the test is simple, for deviation of √2χ2 from √2v – 1 may be interpreted as a normal deviate with units standard deviation. That is,
Alternative Method Of Obtaining The Value of χ2
In a 2x2 table where the cell frequencies and marginal totals are as below:
N is the total frequency and ad the larger cross-product, the value of χ2 can easily be obtained by the following formula:
Conditions for Applying χ2 Test:
The main conditions considered for employing the χ2 test are:
i. N must be to ensure the
similarity between theoretically correct distribution and our sampling
distribution of χ2.
ii. No theoretical cell frequency
should be small when the expected frequencies are too small. If it is so, then
the value of χ2 will be
overestimated and will result in too many rejections of the null hypothesis. To
avoid making incorrect inferences, a general rule is followed that expected
frequency of less than 5 in one cell of a contingency table is too small to
use. When the table contains more than one cell with an expected frequency of
less than 5 then add with the preceding or succeeding frequency so that the
resulting sum is 5 or more. However, in doing so, we reduce the number of
categories of data and will gain less information from contingency table.
iii. The constraints on the cell
frequencies if any should be linear, i.e., they should not involve square and
higher powers of the frequencies such as ∑O = ∑E = N.
The main uses of χ2 test are:
Uses of χ2 test:
The main uses of χ2 test are:
i. χ2 test as a test of independence. With
the help of χ2 test, we
can find out whether two or more
attributes are associated or not. Let’s assume that we have n observations
classified according to some attributes.
We may ask whether the attributes are related or
independent. Thus, we can find out whether there is any association between
skin colour of husband and wife. To examine the attributes that are associated,
we formulate the null hypothesis that there is no association against an
alternative hypothesis and that there is an association between the attributes
under study. If the calculated value of χ2 is less than the table value at a certain level of significance, we say
that the result of the experiment provides no evidence for doubting the
hypothesis. On the other hand, if the calculated value of χ2 is greater than the table value
at a certain level of significance, the results of the experiment do not
support the hypothesis.ii. χ2 test as a test of goodness of fit. This is
due to the fact that it enables us
to ascertain how appropriately the theoretical distributions such as binomial,
Poisson, Normal, etc., fit empirical distributions. When an ideal frequency
curve whether normal or some other type is fitted to the data, we are
interested in finding out how well this curve fits with the observed facts. A
test of the concordance of the two can be made just by inspection, but such a
test is obviously inadequate. Precision can be secured by applying the χ2 test.
iii. χ2 test as a test of homogeneity. The χ2 test of homogeneity is an extension
of the chi-square test of independence. Tests of homogeneity are designed to
determine whether two or more independent random samples are drawn from the
same population or from different populations. Instead of one sample as we use
with independence problem we shall now have 2 or more samples. For example, we
may be interested in finding out whether or not university students of various
levels, i.e., middle and richer poor income groups are homogeneous in
performance in the examination.
Illustration:
In an anti-diabetes campaign in a certain area, a particular medicine, say x was administered to 812 persons out of a total population of 3248. The number of diabetes cases is shown below:
Discuss
the usefulness of medicine x in checking malaria.
Solution:
Let us take the hypothesis that quinine is not effective in checking diabetes. Applying χ2 test :
The calculated value of χ2 is greater than the table value. The hypothesis is rejected. Hence medicine x is useful in checking malaria.
Illustration:
In an experiment on immunization of cattle from tuberculosis the following results were obtained:
Solution:
Let us take the hypothesis that quinine is not effective in checking diabetes. Applying χ2 test :
The calculated value of χ2 is greater than the table value. The hypothesis is rejected. Hence medicine x is useful in checking malaria.
Illustration:
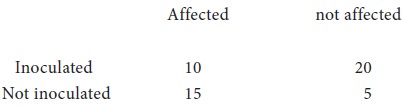
In an experiment on immunization of cattle from tuberculosis the following results were obtained:
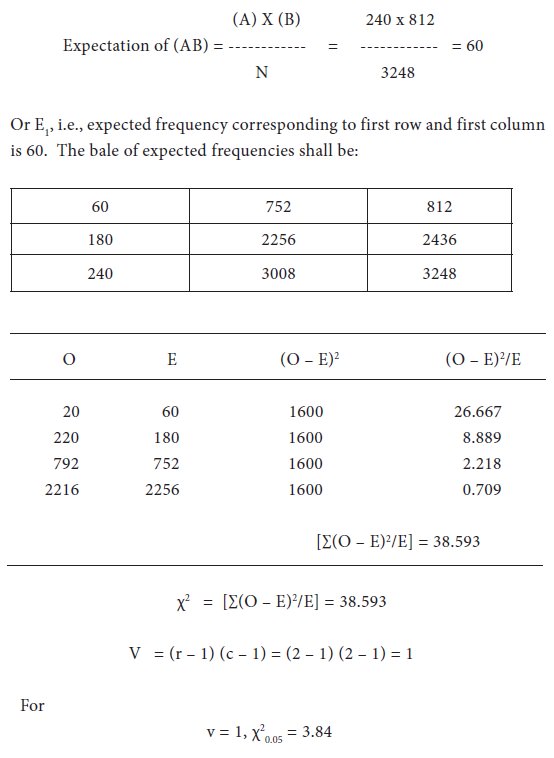
Calculate χ2 and discuss the effect of vaccine in controlling susceptibility to tuberculosis (5% value of χ2 for one degree of freedom = 3.84).
Solution:
Let us take the hypothesis that the vaccine is not effective in controlling susceptibility to tuberculosis. Applying χ2 test:
Since the calculated value of χ2 is
greater than the table value the hypothesis is not true. We, therefore,
conclude the vaccine is effective in controlling susceptibility to
tuberculosis.
Tags : Research Methodology - Statistical Analysis
Last 30 days 1171 views