Accounting For Managers - Management Accounting-Cost Volume Profit Analysis
Profit Volume Graph-Cost Volume Profit Analysis
Posted On :
This graph (called profit graph) gives a pictorial representation of cost-volume profit relationship.
Profit
Volume Graph
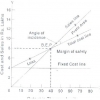
This graph (called profit graph) gives a pictorial representation of cost-volume profit relationship. In this graph x axis represents sales. However, the sales line bisects the graph horizontally to form two areas. The ordinate above the zero sales line, shows the profit area, and the ordinate below the zero sales line indicates the loss or the fixed cost area. The profit-volume-ratio line is drawn from the fixed cost point through the break-even point to the point of maximum profit. In order to construct this graph, therefore, data on profit at a given level of activity, the break-even point and the fixed costs are required.
Illustration 11:
Draw the profit volume graph and find out p/v ratio with the following information:
Output 3,000 units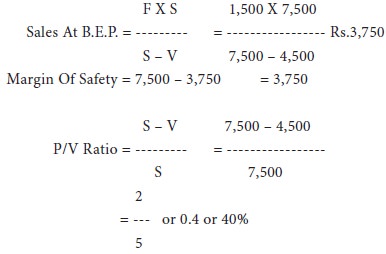
Volume of sales rs.7,500
Variable cost rs.1,500
Fixed cost rs.1,500
Solution:
In the above graph, the profit is rs.1,500. The fixed cost is rs.1,500. Pq represents sales line at point positive, which is the break even point i.e., rs.3,750. The p/v ratio can easily be found out with the help of this graph as follows:
Solution:
In the above graph, the profit is rs.1,500. The fixed cost is rs.1,500. Pq represents sales line at point positive, which is the break even point i.e., rs.3,750. The p/v ratio can easily be found out with the help of this graph as follows:
Tags : Accounting For Managers - Management Accounting-Cost Volume Profit Analysis
Last 30 days 1160 views