Research Methodology - Correlation And Regression Analysis
RANK CORRELATION - Correlation And Regression Analysis
Posted On :
If ranks can be assigned to pairs of observations for two variables X and Y, then the correlation between the ranks is called the rank correlation coefficient.
RANK CORRELATION
If ranks can be assigned to pairs of observations for two variables X and Y, then the correlation between the ranks is called the rank correlation coefficient. It is usually denoted by the symbol ρ (rho). It is given by the formula

where
D = difference between the corresponding ranks of X and Y

and N is the total number of pairs of observations of X and Y.
Problem 5
Alpha Recruiting Agency short listed 10 candidates for final selection. They were examined in written and oral communication skills. They were ranked as follows:
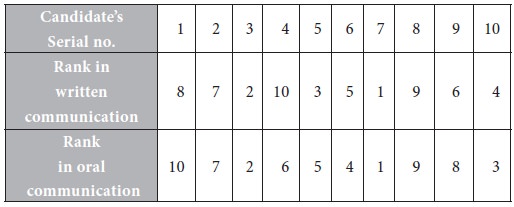
Find out whether there is any correlation between the written and oral communication skills of the short listed candidates.
Solution:
Take X = Written Communication Skill and Y = Oral Communication Skill.
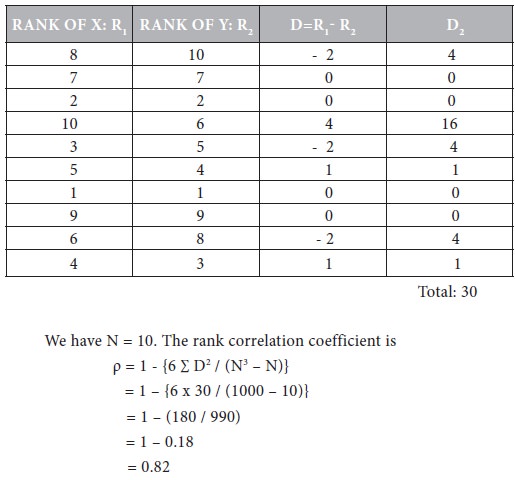
Inference:
From the value of r, it is inferred that there is a high, positive rank correlation between the written and oral communication skills of the short listed candidates.
Problem 6
The following are the ranks obtained by 10 workers in abc company on the basis of their length of service and efficiency.

Find out whether there is any correlation between the ranks obtained by the workers as per the two criteria.
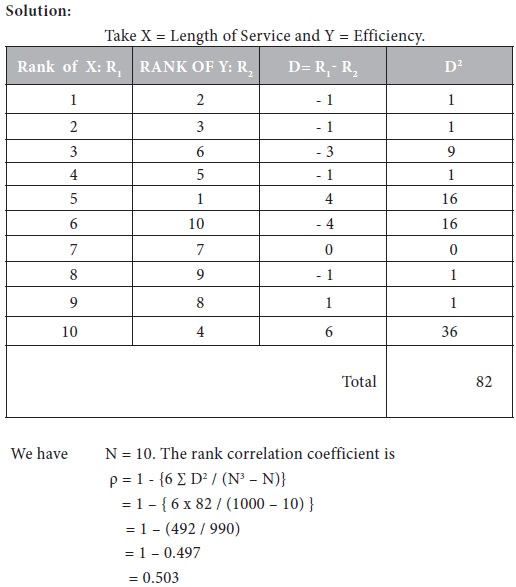
Inference:
The rank correlation coefficient is not high.
Problem 7 (conversion of scores into ranks)
Calculate the rank correlation to determine the relationship between equity shares and preference shares given by the following data on their price.

From the given data on share price, we have to find out the ranks for equity shares and preference shares.
Step 1.
First, consider the equity shares and arrange them in descending order of their price as 1,2,…,8. We have the following ranks:

Step 2.
Next, take the preference shares and arrange them in descending order of their price as 1,2,…,8. We obtain the following ranks:

Step 3.
Calculation of D2:
Fit the given data with the correct rank. Take X = Equity share and Y = Preference share. We have the following table:
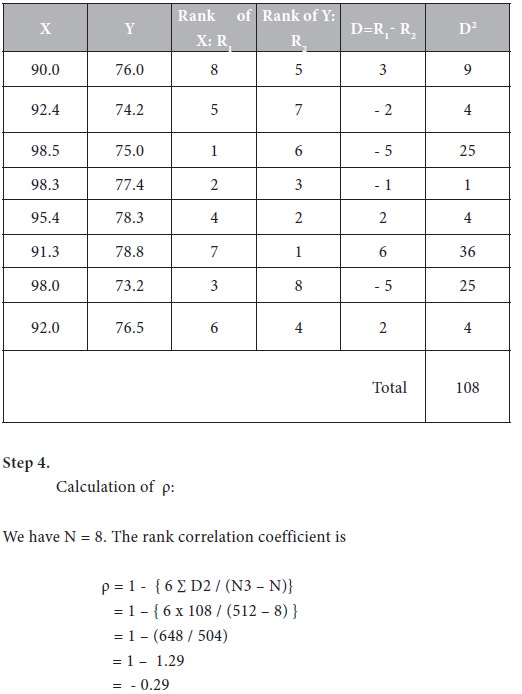
Inference:
From the value of ρ, it is inferred that the equity shares and preference shares under consideration are negatively correlated. However, the absolute value of ρ is 0.29 which is not even moderate.
Problem 8
Three managers evaluate the performance of 10 sales persons in an organization and award ranks to them as follows:
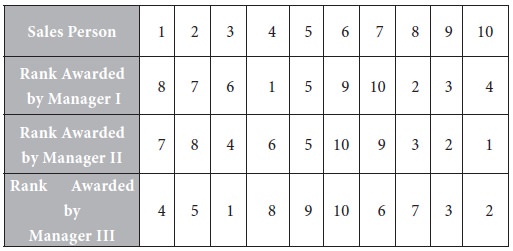
Determine which two managers have the nearest approach in the evaluation of the performance of the sales persons.
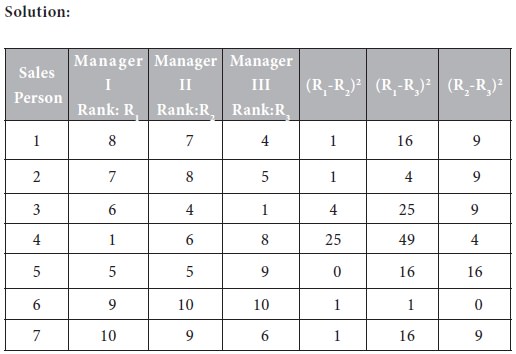
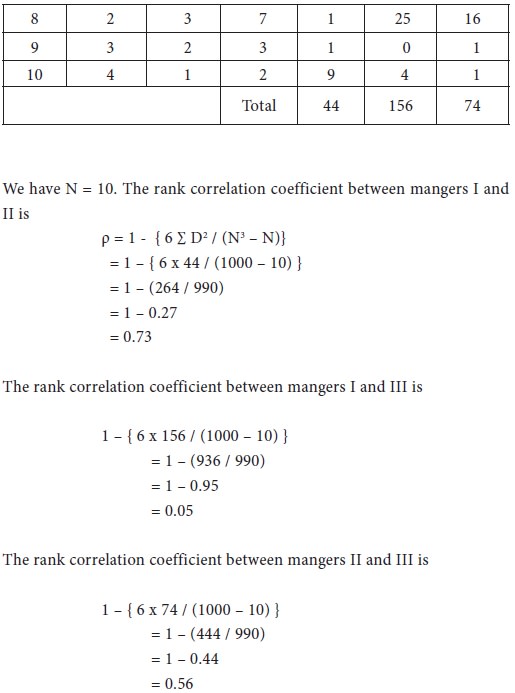
Inference:
Comparing the 3 values of ρ, it is inferred that Mangers I and ii have the nearest approach in the evaluation of the performance of the sales persons.
Spearman’s rank correlation coefficient
If ranks can be assigned to pairs of observations for two variables X and Y, then the correlation between the ranks is called the rank correlation coefficient. It is usually denoted by the symbol ρ (rho). It is given by the formula

where
D = difference between the corresponding ranks of X and Y

and N is the total number of pairs of observations of X and Y.
Problem 5
Alpha Recruiting Agency short listed 10 candidates for final selection. They were examined in written and oral communication skills. They were ranked as follows:

Find out whether there is any correlation between the written and oral communication skills of the short listed candidates.
Solution:
Take X = Written Communication Skill and Y = Oral Communication Skill.

Inference:
From the value of r, it is inferred that there is a high, positive rank correlation between the written and oral communication skills of the short listed candidates.
Problem 6
The following are the ranks obtained by 10 workers in abc company on the basis of their length of service and efficiency.

Find out whether there is any correlation between the ranks obtained by the workers as per the two criteria.

Inference:
The rank correlation coefficient is not high.
Problem 7 (conversion of scores into ranks)
Calculate the rank correlation to determine the relationship between equity shares and preference shares given by the following data on their price.

Solution: |
From the given data on share price, we have to find out the ranks for equity shares and preference shares.
Step 1.
First, consider the equity shares and arrange them in descending order of their price as 1,2,…,8. We have the following ranks:

Step 2.
Next, take the preference shares and arrange them in descending order of their price as 1,2,…,8. We obtain the following ranks:

Step 3.
Calculation of D2:
Fit the given data with the correct rank. Take X = Equity share and Y = Preference share. We have the following table:

Inference:
From the value of ρ, it is inferred that the equity shares and preference shares under consideration are negatively correlated. However, the absolute value of ρ is 0.29 which is not even moderate.
Problem 8
Three managers evaluate the performance of 10 sales persons in an organization and award ranks to them as follows:

Determine which two managers have the nearest approach in the evaluation of the performance of the sales persons.


Inference:
Comparing the 3 values of ρ, it is inferred that Mangers I and ii have the nearest approach in the evaluation of the performance of the sales persons.
Tags : Research Methodology - Correlation And Regression Analysis
Last 30 days 1260 views


