


Home | ARTS | Research Methodology
|
Properties Of Correlation Coefficient - Correlation And Regression Analysis
Research Methodology - Correlation And Regression Analysis
Properties Of Correlation Coefficient - Correlation And Regression Analysis
Posted On :
Let r denote the correlation coefficient between two variables. r≥ is interpreted using the following properties:
Properties Of Correlation Coefficient
Let r denote the correlation coefficient between two variables. r≥ is interpreted using the following properties:
1. The value of r ranges from – 1.0 to 0.0 or from 0.0 to 1.0
2. A value of r = 1.0 indicates that there exists perfect positive correlation between the two variables.
3. A value of r = - 1.0 indicates that there exists perfect negative correlation between the two variables.
4. A value r = 0.0 indicates zero correlation i.e., it shows that there is no correlation at all between the two variables.
5. A positive value of r shows a positive correlation between the two variables.
6. A negative value of r shows a negative correlation between the two variables.
7. A value of r = 0.9 and above indicates a very high degree of positive correlation between the two variables.
8. A value of - 0.9 ≥ r > - 1.0 shows a very high degree of negative correlation between the two variables.
9. For a reasonably high degree of positive correlation, we require r to be from 0.75 to 1.0.
10. A value of r from 0.6 to 0.75 may be taken as a moderate degree of positive correlation.
Problem 1
The following are data on Advertising Expenditure (in Rupees Thousand) and Sales (Rupees in lakhs) in a company.

Determine the correlation coefficient between them and interpret the result.
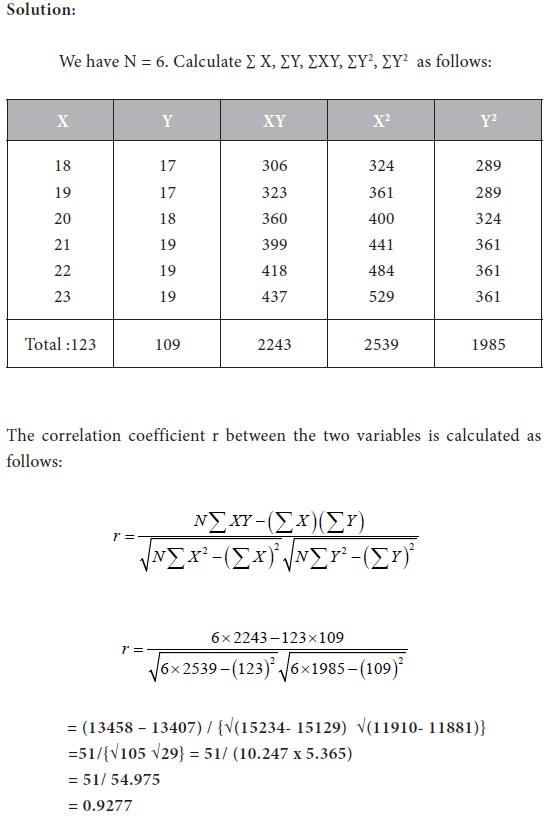
Interpretation
The value of r is 0.92. It shows that there is a high, positive correlation between the two variables ‘Advertising Expenditure’ and ‘Sales’. This provides a basis to consider some functional relationship between them.
Interpretation
The value of r is 0.21. Even though it is positive, the value of r is very less. Hence we conclude that there is no correlation between the two variables X and Y. Consequently we cannot construct any functional relational relationship between them.
Interpretation
The value of r is - 0.92. The negative sign in r shows that the two variables move in opposite directions. The absolute value of r is 0.92 which is very high. Therefore we conclude that there is high negative correlation between the two variables ‘Supply’ and ‘Price’.
Problem 4
Consider the following data on income and savings in Rs. Thousand.
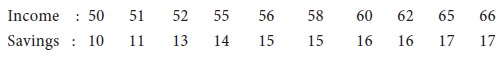
Interpretation
The value of r is 0.93. The positive sign in r shows that the two variables move in the same direction. The value of r is very high. Therefore we conclude that there is high positive correlation between the two variables ‘Income’ and ‘Savings’. As a result, we can construct a functional relationship between them.
Let r denote the correlation coefficient between two variables. r≥ is interpreted using the following properties:
1. The value of r ranges from – 1.0 to 0.0 or from 0.0 to 1.0
2. A value of r = 1.0 indicates that there exists perfect positive correlation between the two variables.
3. A value of r = - 1.0 indicates that there exists perfect negative correlation between the two variables.
4. A value r = 0.0 indicates zero correlation i.e., it shows that there is no correlation at all between the two variables.
5. A positive value of r shows a positive correlation between the two variables.
6. A negative value of r shows a negative correlation between the two variables.
7. A value of r = 0.9 and above indicates a very high degree of positive correlation between the two variables.
8. A value of - 0.9 ≥ r > - 1.0 shows a very high degree of negative correlation between the two variables.
9. For a reasonably high degree of positive correlation, we require r to be from 0.75 to 1.0.
10. A value of r from 0.6 to 0.75 may be taken as a moderate degree of positive correlation.
Problem 1
The following are data on Advertising Expenditure (in Rupees Thousand) and Sales (Rupees in lakhs) in a company.
Determine the correlation coefficient between them and interpret the result.
Interpretation
The value of r is 0.92. It shows that there is a high, positive correlation between the two variables ‘Advertising Expenditure’ and ‘Sales’. This provides a basis to consider some functional relationship between them.
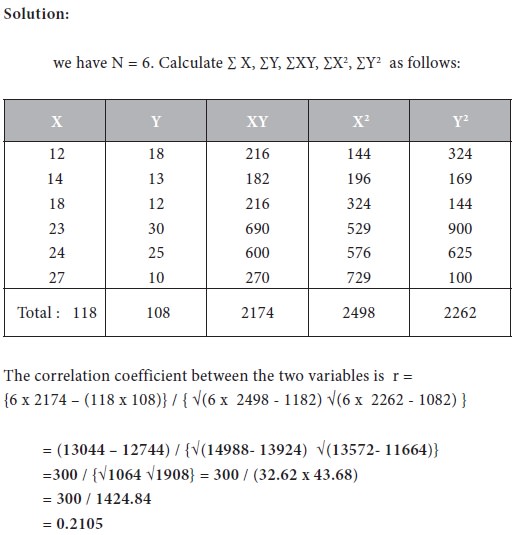
Problem 2
Consider the following data on two variables X and Y.
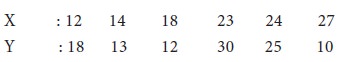
Consider the following data on two variables X and Y.
Determine the correlation coefficient between the two
variables and interpret the result.
Interpretation
The value of r is 0.21. Even though it is positive, the value of r is very less. Hence we conclude that there is no correlation between the two variables X and Y. Consequently we cannot construct any functional relational relationship between them.
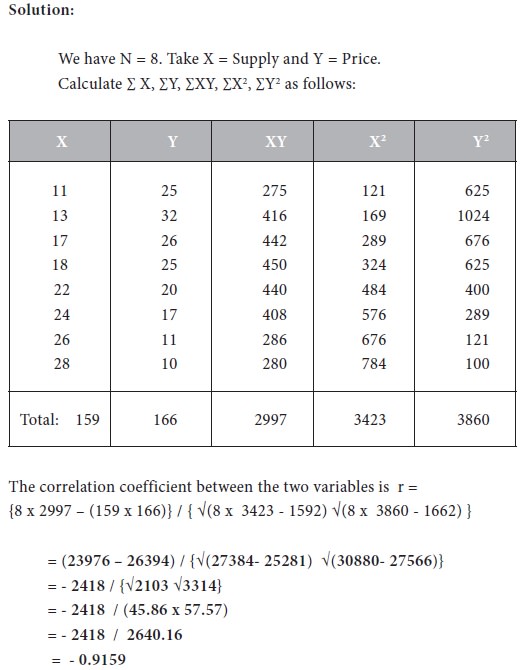
Problem 3
Consider the following data on supply and price. Determine the correlation Coefficient between the two variables and interpret the result.
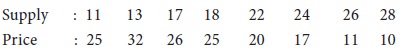
Consider the following data on supply and price. Determine the correlation Coefficient between the two variables and interpret the result.
Determine the correlation coefficient between the two
variables and interpret the result.
Interpretation
The value of r is - 0.92. The negative sign in r shows that the two variables move in opposite directions. The absolute value of r is 0.92 which is very high. Therefore we conclude that there is high negative correlation between the two variables ‘Supply’ and ‘Price’.
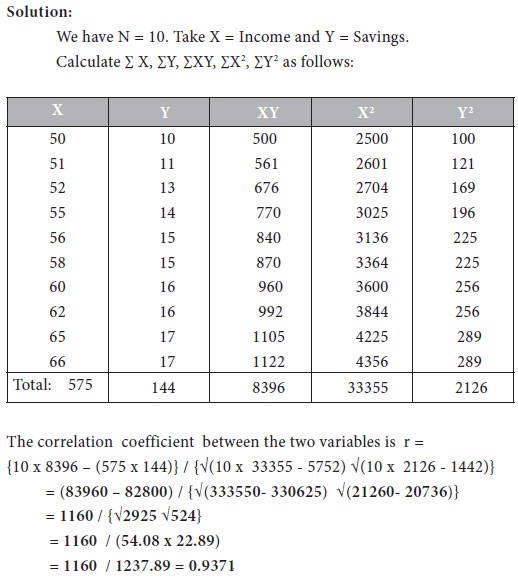
Problem 4
Consider the following data on income and savings in Rs. Thousand.
Determine the correlation coefficient between the two
variables and interpret the result.
Interpretation
The value of r is 0.93. The positive sign in r shows that the two variables move in the same direction. The value of r is very high. Therefore we conclude that there is high positive correlation between the two variables ‘Income’ and ‘Savings’. As a result, we can construct a functional relationship between them.
Tags : Research Methodology - Correlation And Regression Analysis
Last 30 days 1936 views