Home | ARTS | Strategic Management
|
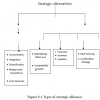
Portfolio Restructuring - Strategic Alternatives & Choice of Strategy
Strategic Management - Strategy Formulation
Portfolio Restructuring - Strategic Alternatives & Choice of Strategy
Posted On :
Large, diversified organizations commonly use a number of these strategies in combination.
Portfolio Restructuring
Large, diversified organizations commonly use a number of these strategies in combination. For example, an organization may simultaneously seek growth through the acquisition of new businesses, employ a stability strategy for some of its existing businesses, and divest itself of other businesses. Clearly, formulating a consistent organizational strategy in large, diversified companies is very complicated, because a number of different business – level strategies need to be coordinated to achieve overall organizational objectives. Business portfolio models are designed to help managers deal with this problem.
Business portfolio models are tools for analyzing (1) the relative position of each of an organization’s businesses in its industry and (2) the relationships among all the of the organization’s businesses. Two well-known approaches to developing business portfolios include:
1. Boston Consulting Group (BCG) growth – share matrix
2. General Electric’s (GE’s) multi-factor portfolio matrix.
The Boston Consulting Group, a leading management consulting firm, developed and popularized a strategy formulation approach called the growth – share matrix, which is shown in Figure 9-3. The basic idea underlying this approach is that a firm should have a balanced portfolio of businesses such that some generate more cash than they use and can thus support other businesses that need cash to develop and become profitable. The role of each business is determined on the basis of two factors: the growth rate of its market and the share of that market that it enjoys.
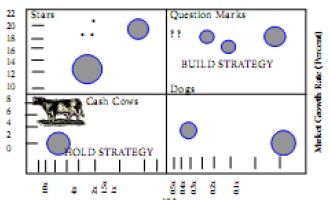
Figure9-3 BCG’s Growth – Share Matrix (Source: Adapted from B. Hedley, “Strategy and the Business Portfolio,” Long Range Planning, February 1977, p.12.
The vertical axis indicates the market growth rate, what is the annual growth percentage of the market (current or forecasted) in which the business operates. The horizontal axis indicates market share dominance or relative marker share. It is computed by dividing the firm’s market share (in units) by the market share of the largest competitor).
The growth – share matrix has four cells, which reflect the four possible combinations of high and low growth wit high and low market share. These cells represent particular types of businesses, each of which has a particular role to play in the overall business portfolio. The cells are labeled:
Question marks (sometimes called problem children) Company business that operate in a high-growth market but have low relative market share. Most businesses start off as question marks, in that they enter a high – growth market in which there is already a market leader. A question mark generally requires the infusion of a lot of funds. It has to keep adding plant, equipment, and personnel to keep up with the fast – growing market, and it wants to overtake the leader. The term question mark is well chosen, because the organization has to think hard about whether to keep investing funds in the business or to get out.
Stars They are question – mark businesses that have become successful. A star is the market leader in a high – growth market, but it does not necessarily provide much cash. The organization has to spend a great deal of money keeping up with the market’s rate of growth and fighting off competitors’ attacks. Stars are often cash – using rather than cash –generating Even so, they are usually profitable in time.
Cash cows Businesses in markets whose annual growth rate is less than 10 percent but that still have the largest relative market share. A cash cow is so called because it produces a lot of cash for the
Dogs Businesses that have weak market shares in low-growth markets. They typically generate low profits or losses, although they may bring in some cash. Such businesses frequently consume more management time than they are worth and need to be phased out. However, an organization may have good reasons to hold onto a dog, such as an expected turnaround in the market growth rate or a new chance at market leadership.
After each of an organization’s businesses is plotted on the growth – share matrix, the next step is to evaluate whether the portfolio is healthy and well balanced. A balanced portfolio has a number of stars and cash cows and no too many questions marks or dogs. This balance is important because the organization needs cash not only to maintain existing businesses but also to develop new businesses. Depending on the position of each business, four basic strategies can be formulated:
Build market share This strategy is appropriate for question marks that must increase their share in order to become stars. For some businesses, short-term profits may have to be forgone to gain market share and future long-term profits.
Hold market share This strategy is appropriate for cash cows with strong share positions. The cash generated by mature cash cows is critical for supporting other businesses and financing innovations. However, the cost of building share for cash cows is likely to be too high to be a profitable strategy.
Harvest Harvesting involves milking as much short-term cash from a business as possible, even allowing market share to decline if necessary. Weak cash cows that do not appear to have a promising future are candidates for harvesting, as are question marks and dogs.
Divest Divesting involves selling or liquidating a business because the resources devoted to it can be invested more profitably in other businesses. This strategy is appropriate for those dogs and question
However the growth share matrix is not fool proof. It has the following loopholes.
1. Focuses on balancing cash flows only but organizations are mostly interested in return on investments.
2. Is not always clear what share of what market is
relevant in the analysis.
3. Believes that there is a strong relationship between market share and return on investment. But research proves that only a 10% change in market share is associated with only ‘percent change in return on investment.
4. The other factors like size and growth profile of the market and distinctive competences of the firm, competition etc is not considered.
5. It does not provide direct assistance in comparing
different businesses in terms of investment opportunities. For example it is
difficult to decide between two question marks and decide which should be
developed into a star.
6. Offers only general strategy recommendations without specifying how to implement them.
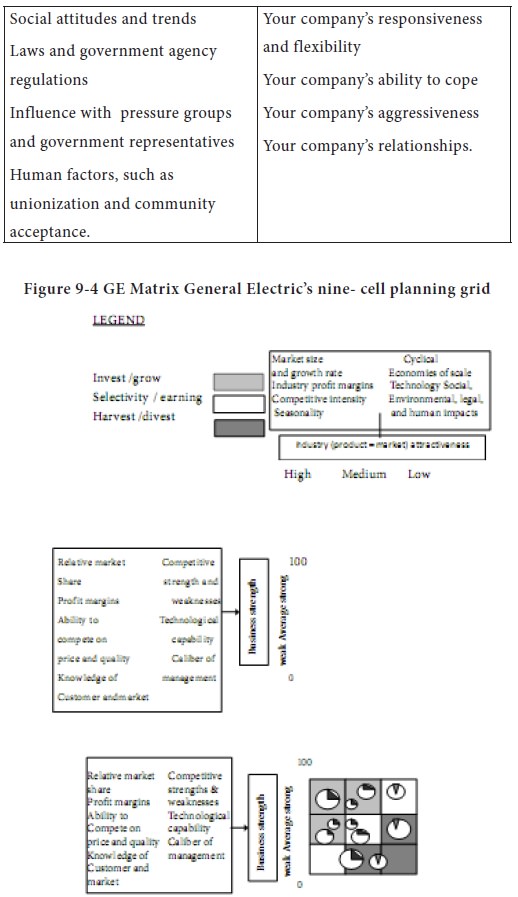
This approach has a variety of names, including the nine -cell GE matrix, GE’s nine-cell business portfolio matrix, and the market attractiveness – business strengths matrix. The basic approach is shown in Figure 9-4. Each circle in this matrix represents the entire market, and the shaded portion represents the organization’s business market share
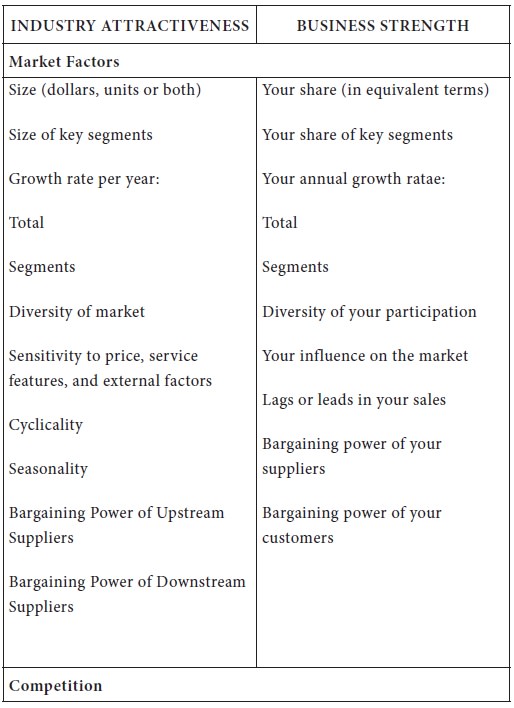
Each of an organization’s businesses is plotted in the matrix on two dimensions, industry attractiveness and business strength. Each of these two major dimensions is a composite measure of a variety of factors. To use this approach, an organization must determine what factors are most critical for defining industry attractiveness and business strength. Table below lists some of the factors that are commonly used to locate businesses on these dimensions.
The next step in developing this matrix is to weight each variable on the basis of its perceived importance relative to the other factors (hence the total of the weight must be 1.0). Then managers must indicate, on a scale of 1 to 5, how low or high their business scores on that factor.
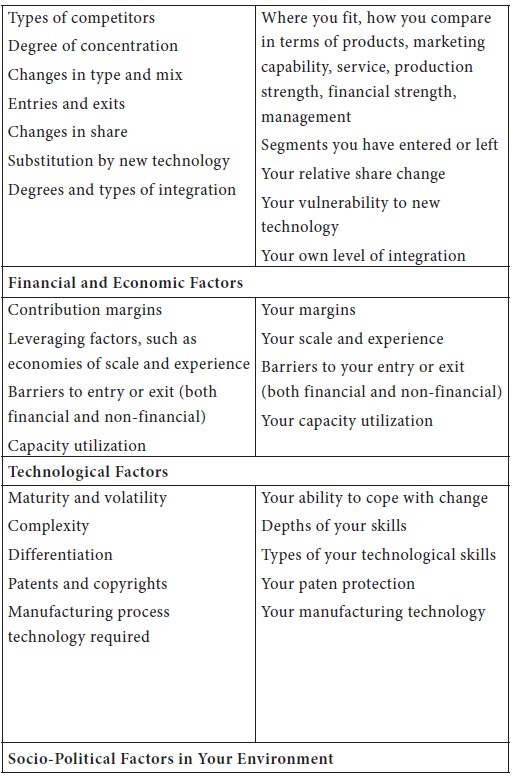
Table 9-3 Factors Contributing to Industry Attractiveness and Business Strength.
Depending
on where businesses are plotted on the matrix, three basic strategies are
formulated
2. Second,
as we have noted, the two dimensions of industry attractiveness and business
strength are excellent criteria for rating potential business success.
3. Third, the approach forces managers to be specific about their evaluations of the impact of particular variables on overall business success.
However, the multifactor portfolio matrix also suffers some of the same limitations as the growth –share matrix.
1. It does not solve the problem of determining the appropriate market, and it does not offer anything more than general strategy recommendations.
2. The
measures are subjective and can be very ambiguous, particularly when one is
considering different businesses.
Portfolio models provide graphical frameworks for analyzing relationships among the businesses of large, diversified organizations, and they can yield useful strategy recommendations. However, no such model yet devised provides a universally accepted approach to dealing with these issues. Portfolio models should never be applied in a mechanical fashion, any conclusion they suggest must be carefully considered in the light of sound managerial judgment and experience.
Large, diversified organizations commonly use a number of these strategies in combination. For example, an organization may simultaneously seek growth through the acquisition of new businesses, employ a stability strategy for some of its existing businesses, and divest itself of other businesses. Clearly, formulating a consistent organizational strategy in large, diversified companies is very complicated, because a number of different business – level strategies need to be coordinated to achieve overall organizational objectives. Business portfolio models are designed to help managers deal with this problem.
Business portfolio models are tools for analyzing (1) the relative position of each of an organization’s businesses in its industry and (2) the relationships among all the of the organization’s businesses. Two well-known approaches to developing business portfolios include:
1. Boston Consulting Group (BCG) growth – share matrix
2. General Electric’s (GE’s) multi-factor portfolio matrix.
BCG’s Growth – Share Matrix
The Boston Consulting Group, a leading management consulting firm, developed and popularized a strategy formulation approach called the growth – share matrix, which is shown in Figure 9-3. The basic idea underlying this approach is that a firm should have a balanced portfolio of businesses such that some generate more cash than they use and can thus support other businesses that need cash to develop and become profitable. The role of each business is determined on the basis of two factors: the growth rate of its market and the share of that market that it enjoys.
Relative Market Share
Figure9-3 BCG’s Growth – Share Matrix (Source: Adapted from B. Hedley, “Strategy and the Business Portfolio,” Long Range Planning, February 1977, p.12.
The vertical axis indicates the market growth rate, what is the annual growth percentage of the market (current or forecasted) in which the business operates. The horizontal axis indicates market share dominance or relative marker share. It is computed by dividing the firm’s market share (in units) by the market share of the largest competitor).
The growth – share matrix has four cells, which reflect the four possible combinations of high and low growth wit high and low market share. These cells represent particular types of businesses, each of which has a particular role to play in the overall business portfolio. The cells are labeled:
Question marks (sometimes called problem children) Company business that operate in a high-growth market but have low relative market share. Most businesses start off as question marks, in that they enter a high – growth market in which there is already a market leader. A question mark generally requires the infusion of a lot of funds. It has to keep adding plant, equipment, and personnel to keep up with the fast – growing market, and it wants to overtake the leader. The term question mark is well chosen, because the organization has to think hard about whether to keep investing funds in the business or to get out.
Stars They are question – mark businesses that have become successful. A star is the market leader in a high – growth market, but it does not necessarily provide much cash. The organization has to spend a great deal of money keeping up with the market’s rate of growth and fighting off competitors’ attacks. Stars are often cash – using rather than cash –generating Even so, they are usually profitable in time.
Cash cows Businesses in markets whose annual growth rate is less than 10 percent but that still have the largest relative market share. A cash cow is so called because it produces a lot of cash for the
Dogs Businesses that have weak market shares in low-growth markets. They typically generate low profits or losses, although they may bring in some cash. Such businesses frequently consume more management time than they are worth and need to be phased out. However, an organization may have good reasons to hold onto a dog, such as an expected turnaround in the market growth rate or a new chance at market leadership.
After each of an organization’s businesses is plotted on the growth – share matrix, the next step is to evaluate whether the portfolio is healthy and well balanced. A balanced portfolio has a number of stars and cash cows and no too many questions marks or dogs. This balance is important because the organization needs cash not only to maintain existing businesses but also to develop new businesses. Depending on the position of each business, four basic strategies can be formulated:
Build market share This strategy is appropriate for question marks that must increase their share in order to become stars. For some businesses, short-term profits may have to be forgone to gain market share and future long-term profits.
Hold market share This strategy is appropriate for cash cows with strong share positions. The cash generated by mature cash cows is critical for supporting other businesses and financing innovations. However, the cost of building share for cash cows is likely to be too high to be a profitable strategy.
Harvest Harvesting involves milking as much short-term cash from a business as possible, even allowing market share to decline if necessary. Weak cash cows that do not appear to have a promising future are candidates for harvesting, as are question marks and dogs.
Divest Divesting involves selling or liquidating a business because the resources devoted to it can be invested more profitably in other businesses. This strategy is appropriate for those dogs and question
However the growth share matrix is not fool proof. It has the following loopholes.
1. Focuses on balancing cash flows only but organizations are mostly interested in return on investments.
3. Believes that there is a strong relationship between market share and return on investment. But research proves that only a 10% change in market share is associated with only ‘percent change in return on investment.
4. The other factors like size and growth profile of the market and distinctive competences of the firm, competition etc is not considered.
6. Offers only general strategy recommendations without specifying how to implement them.
Ge Multi-Factor Port Folio Matrix
This approach has a variety of names, including the nine -cell GE matrix, GE’s nine-cell business portfolio matrix, and the market attractiveness – business strengths matrix. The basic approach is shown in Figure 9-4. Each circle in this matrix represents the entire market, and the shaded portion represents the organization’s business market share
Each of an organization’s businesses is plotted in the matrix on two dimensions, industry attractiveness and business strength. Each of these two major dimensions is a composite measure of a variety of factors. To use this approach, an organization must determine what factors are most critical for defining industry attractiveness and business strength. Table below lists some of the factors that are commonly used to locate businesses on these dimensions.
The next step in developing this matrix is to weight each variable on the basis of its perceived importance relative to the other factors (hence the total of the weight must be 1.0). Then managers must indicate, on a scale of 1 to 5, how low or high their business scores on that factor.
Table 9-3 Factors Contributing to Industry Attractiveness and Business Strength.
1. Invest/grow,
2. Selective investment, and
3. Harvest/divest.
Businesses falling in the cells that form a diagonal from lower left to upper right are medium-strength businesses that should be invested in only selectively. Businesses in the cells above and to the left of this diagonal are the strongest; they are the ones for which the company should employ an invest/grow strategy. Businesses in the cells below and to the right of the diagonal are low in overall strength and are serious candidates for a harvest/divest strategy.
This approach has several advantages over the growth-share matrix.
1. First, it provides a mechanism for including a host of relevant variables in the process of formulating strategy.
3. Third, the approach forces managers to be specific about their evaluations of the impact of particular variables on overall business success.
However, the multifactor portfolio matrix also suffers some of the same limitations as the growth –share matrix.
1. It does not solve the problem of determining the appropriate market, and it does not offer anything more than general strategy recommendations.
Portfolio models provide graphical frameworks for analyzing relationships among the businesses of large, diversified organizations, and they can yield useful strategy recommendations. However, no such model yet devised provides a universally accepted approach to dealing with these issues. Portfolio models should never be applied in a mechanical fashion, any conclusion they suggest must be carefully considered in the light of sound managerial judgment and experience.
Tags : Strategic Management - Strategy Formulation
Last 30 days 1392 views