


Research Methodology - Analysis Of Variance
ANOVA Table - Analysis Of Variance
Posted On :
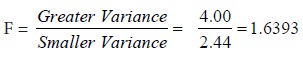
The calculated value of F is less than the table value ofF. Therefore, the null hypothesis is accepted. It is concluded that there is no significant difference in the performance of the sales persons, at 5% level of significance.
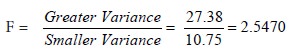
ANOVA Table
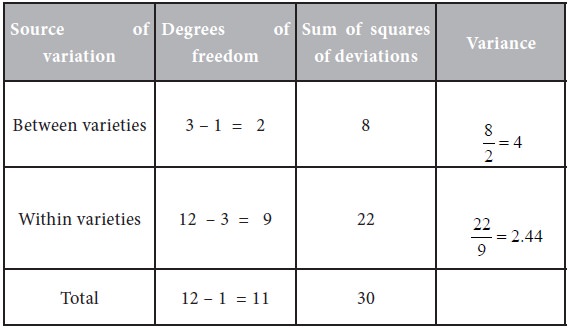
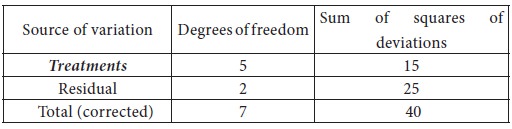
Calculation of F value:
Degrees of freedom for greater variance (df1 ) = 2Degrees of freedom for smaller variance (df1 ) = 9
Let us take the level of significance as 5%
The table value of F = 4.26
Inference:
The calculated value of F is less than the table value ofF. Therefore, the null hypothesis is accepted. It is concluded that there is no significant difference in the performance of the sales persons, at 5% level of significance.
Method II (Short cut Method):
∑ A = 32, ∑ B = 28, ∑ C = 24.
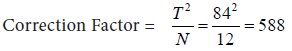
T= Sum of all the sample items
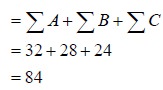
N = Total number of items in all the samples = 4 + 4 + 4 =12
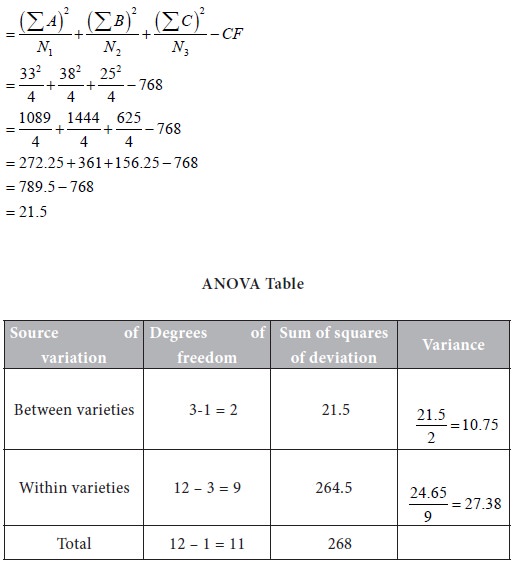
Calculate the sum of squares of the observed values as follows:
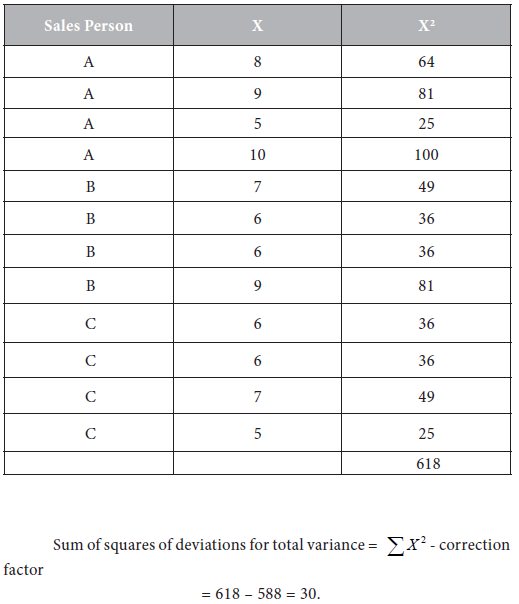
Sum of squares of deviations for variance between samples
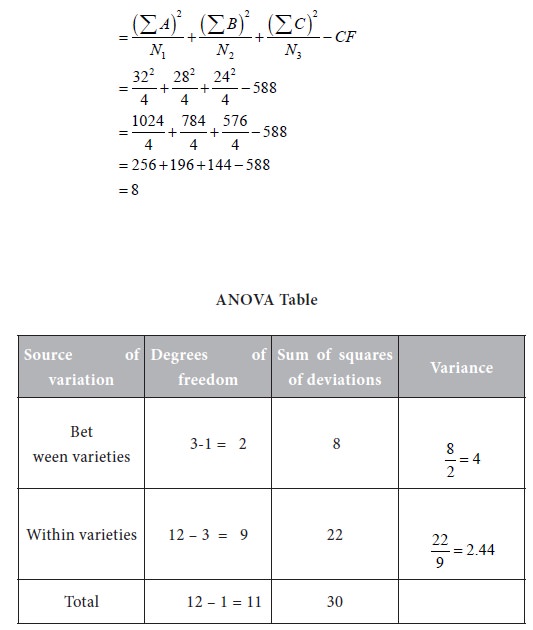
It is to be noted that the ANOVA tables in the methods I and II are one and the same. For the further steps of calculation of F value and drawing inference, refer to method I.
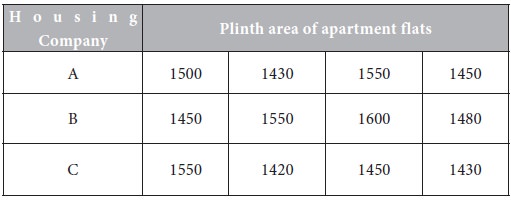
Problem 2
The following are the details of plinth areas of ownership apartment flats offered by 3 housing companies A,B,C. Use analysis of variance to determine whether there is any significant difference in the plinth areas of the apartment flats.
Use analysis of variance to determine whether there is any significant difference in the plinth areas of the apartment’s flats.
Note:
As the given figures are large, working with them will be difficult. Therefore, we use the following facts:
i). Variance ratio is independent of the change of origin.
ii). Variance ratio is independent of the change of scale.
In the problem under consideration, the numbers vary from 1420 to 1600. So we follow a method called the coding method. First, let us subtract 1400 from each item. We get the following transformed data:
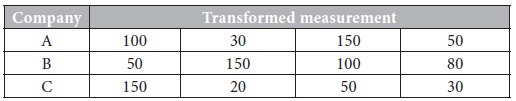
Next, divide each entry by 10.
The transformed data are given below.
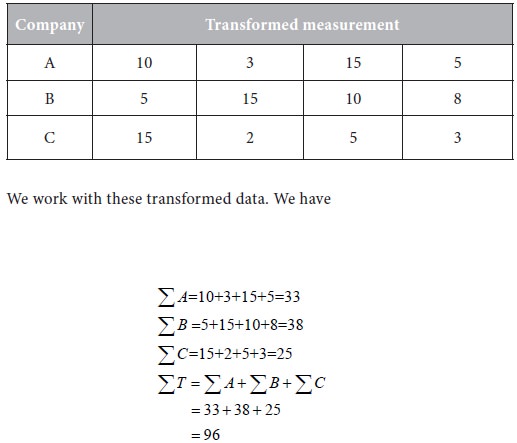
N = Total number of items in all the samples = 4 + 4 + 4 = 12
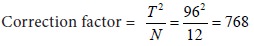
Calculate the sum of squares of the observed values as follows:
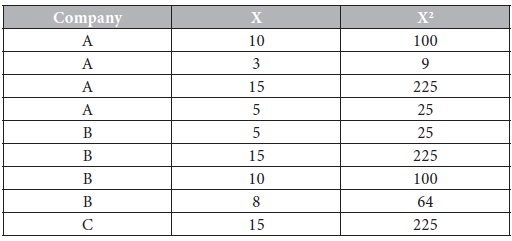
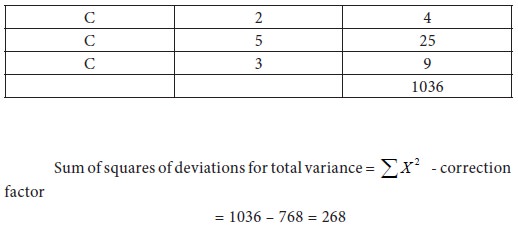
Sum of squares of deviations for variance between samples
Calculation of F value:
Degrees of freedom for greater variance (df1 ) = 9
Degrees of freedom for smaller variance (df2 ) = 2
The table value of f at 5% level of significance = 19.38
Inference:
Since the calculated value of F is less than the table value of F, the null hypothesis is accepted and it is concluded that there is no significant difference in the plinth areas of ownership apartment flats offered by the three companies, at 5% level of significance.
Problem 3
A finance manager has collected the following information on the performance of three financial schemes.
Interpret the information obtained by him.
Note: ‘Treatments’ means ‘Between varieties’. ‘Residual’ means ‘Within varieties’ or ‘Error’.
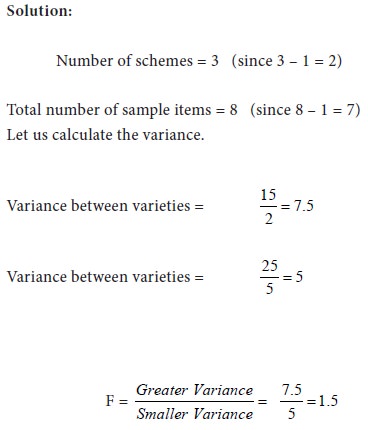
Degrees of freedom for greater variance
df1 ) = 2
Degrees of freedom for smaller variance
df1 ) = 5
The total value of F at 5% level of significance
= 5.79
Inference:
Since the calculated value of F is less than the table value of F we accept the null-hypothesis and conclude that there is no significant difference in the performance of the three financial schemes.
Calculation of F value:
Degrees of freedom for greater variance (df1 ) = 2Degrees of freedom for smaller variance (df1 ) = 9
Let us take the level of significance as 5%
The table value of F = 4.26
Inference:
The calculated value of F is less than the table value ofF. Therefore, the null hypothesis is accepted. It is concluded that there is no significant difference in the performance of the sales persons, at 5% level of significance.
Method II (Short cut Method):
∑ A = 32, ∑ B = 28, ∑ C = 24.
T= Sum of all the sample items
N = Total number of items in all the samples = 4 + 4 + 4 =12
Calculate the sum of squares of the observed values as follows:
Sum of squares of deviations for variance between samples
It is to be noted that the ANOVA tables in the methods I and II are one and the same. For the further steps of calculation of F value and drawing inference, refer to method I.
Problem 2
The following are the details of plinth areas of ownership apartment flats offered by 3 housing companies A,B,C. Use analysis of variance to determine whether there is any significant difference in the plinth areas of the apartment flats.
Use analysis of variance to determine whether there is any significant difference in the plinth areas of the apartment’s flats.
Note:
As the given figures are large, working with them will be difficult. Therefore, we use the following facts:
i). Variance ratio is independent of the change of origin.
ii). Variance ratio is independent of the change of scale.
In the problem under consideration, the numbers vary from 1420 to 1600. So we follow a method called the coding method. First, let us subtract 1400 from each item. We get the following transformed data:
Next, divide each entry by 10.
The transformed data are given below.
N = Total number of items in all the samples = 4 + 4 + 4 = 12
Calculate the sum of squares of the observed values as follows:
Sum of squares of deviations for variance between samples
Calculation of F value:
Degrees of freedom for greater variance (df1 ) = 9
Degrees of freedom for smaller variance (df2 ) = 2
The table value of f at 5% level of significance = 19.38
Inference:
Since the calculated value of F is less than the table value of F, the null hypothesis is accepted and it is concluded that there is no significant difference in the plinth areas of ownership apartment flats offered by the three companies, at 5% level of significance.
Problem 3
A finance manager has collected the following information on the performance of three financial schemes.
Interpret the information obtained by him.
Note: ‘Treatments’ means ‘Between varieties’. ‘Residual’ means ‘Within varieties’ or ‘Error’.
Degrees of freedom for greater variance
df1 ) = 2
Degrees of freedom for smaller variance
df1 ) = 5
The total value of F at 5% level of significance
= 5.79
Inference:
Since the calculated value of F is less than the table value of F we accept the null-hypothesis and conclude that there is no significant difference in the performance of the three financial schemes.
Tags : Research Methodology - Analysis Of Variance
Last 30 days 2592 views