


Accounting For Managers - Ratio Analysis
Ratio Analysis - Case Study and Summary
Summary Financial statements by themselves do not give the required information both for internal management and for outsiders. They must be analysed and interpreted to get meaningful information about the various aspects of the concern. Analysing financial statements is a process of evaluating the relationship between the component parts of the financial statements to obtain a proper understanding of a firm’s performance. Financial analysis may be external or internal analysis or horizontal or vertical analysis. Financial analysis can be carried out through a number of tools like ratio analysis, funds flow analysis, cash flow analysis etc. Among the various tools available for their analysis, ratio analysis is the most popularly used tool. The main purpose of ratio analysis is to measure past performance and project future trends. It is also used for inter-firm and intra-firm comparison as a measure of comparative productivity. The financial analyst x-rays the financial conditions of a concern by the use of various ratios and if the conditions are not found to be favourable, suitable steps can be taken to overcome the limitations.
The following figures are extracted from the balance sheets of a Company:
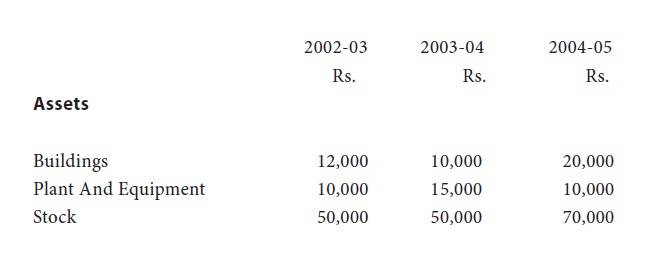
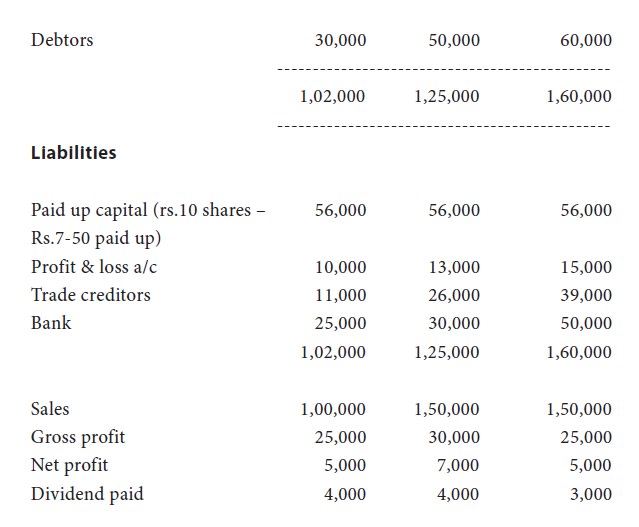
The opening stock at the beginning of the year 2002-03 was rs.4,000. As a financial analyst comment on the comparative short-term, activity, solvency, profitability and financial position of the company during the three year period.
Solution:
To test the short-term solvency the following ratios are calculated for three years:
I. Current ratio and
Ii. Quick ratio
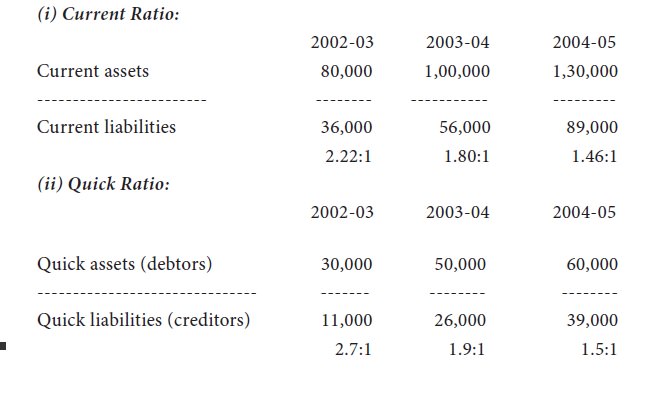
As the
standard for current ratio is 2:1 the working capital position of the company
has weakened in the 2nd year and 3rd year. However the quick ratio for all the
three years is well above the standard of 1:1. Thus it can be said that the
short term solvency position of the company shows a mixed trend.
Activity Ratios:
To test
the operational efficiency of the company the following ratios are calculated.
Debtors turnover ratio and inventory turnover ratio.
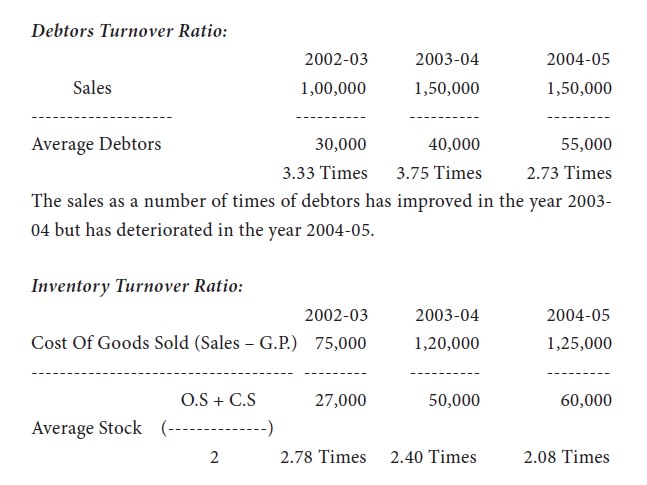
Though
there is no standard for inventory turnover ratio, higher the ratio, better is
the activity level of the concern. From this angle the ratio has come down
gradually during the three year period indicating slow moving of stock.
Profitability Ratios:
To analyse the profitability position of the company, gross profit ratio and net profit ratio are calculated.
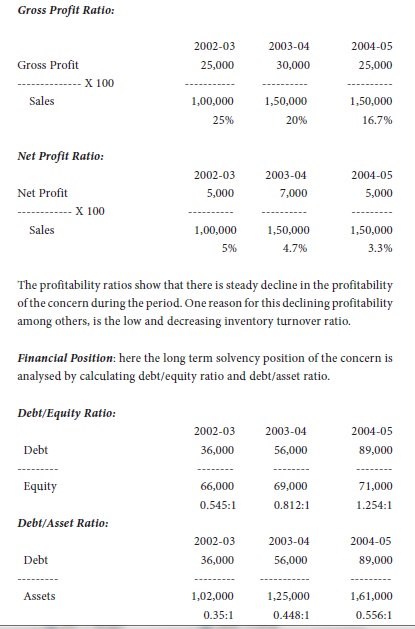
Debt
equity ratio expresses the existence of debt for every re.1 of equity. From
this standpoint the share of debt in comparison to equity is increasing year
after year and in the last year the debt is even more than equity. Debt asset
ratio gives how much of assets have been acquired using debt funds. The
calculation of this ratio reveals that in the 1st year 35% of assets were
purchased using debt funds which has increased to 44.8% in the 2nd year and
55.6% in the 3rd year. Thus both the ratios reveal that the debt component in
the capital structure is increasing which has far reaching consequences.