


Home | ARTS | Accounting For Managers
|
Ratio Analysis-Illustrations - Ratios From Shareholders’ Point Of View - Full Calculation
Accounting For Managers - Ratio Analysis
Ratio Analysis-Illustrations - Ratios From Shareholders’ Point Of View - Full Calculation
Posted On :
Ratios From Shareholders’ Point Of View
(Refer Previous article for the introduction)
Illustrations
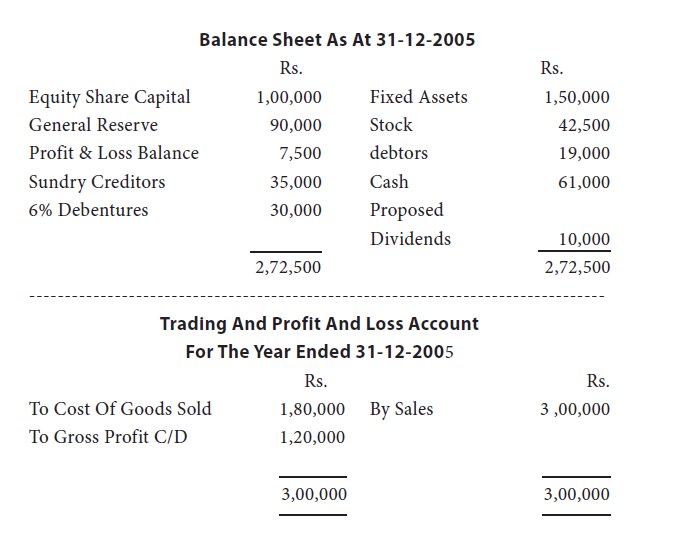
Illustration 4: the following are the financial statements of yesye limited for the year 2005.
To Expenses 1,00,000 By Gross Profit B/D 1,20,000
To Net Profit 20,000
1,20,000 1,20,000
You are required to compute the following:
1) Current Ratio
2) Acid Test Ratio
3) Gross Profit Ratio
4) Debtors’ Turnover Ratio
5) Fixed Assets To Net Tangible Worth
6) Turnover To Fixed Assets
Solution:
Current Assets
1) Current Ratio = ---------------------
Current Liabilities
1,22,500
= ----------- = 2.7:1.
45,000
Quick Assets
2) Acid Test Ratio = -------------------
Quick Liabilities
80,000
= ----------- = 1.8:1.
45,000
Gross Profit
3) Gross Profit Ratio = ---------------------- X 100
Sales
1,20,000
= ------------- X 100 = 40%
3,00,000
Net Sales
4) Debtors’ Turnover Ratio = ---------------------
Average Debtors
3,00,000
= ------------- = 15.78 Times.
19,000
No. Of Days In The Year
Collection Period = -----------------------------
Debtors’ Turnover
365
= ----------- = 23 Days
15.78
Fixed Asset To Fixed Assets
5)Net Tangible Worth = ----------------------- X 100
Proprietor’s Fund
1,50,000
= ------------- X 100 = 76%
1,97,500
Net Sales
6) Turnover To Fixed Assets = ------------------
Fixed Assets
3,00,000
= ----------- = 2 Times
1,50,000
Illustration 5: from the following details prepare a statement of proprietary fund with as many details as possible.
1) Stock Velocity 6
2) Capital Turnover Ratio 2
3) Fixed Assets Turnover Ratio 4
4) Gross Profit Turnover Ratio 20%
5) Debtors’ Velocity 2 Months
6) creditors’ velocity 73 days
Gross profit was rs.60,000. Reserves and surplus amount to 20,000. Closing stock was rs.5,000 in excess of opening stock.
Solution:
1. Calculation Of Sales
Gross Profit
Gross Profit Ratio = --------------- X 100 = 20%
Sales
Rs.60,000 20
= --------------- = --------
Sales 100
1
= ---
5
Sales: Rs.3,00,000
2. Calculation Of Sundry Debtors
Debtors
Debtors’ Velocity = ------------ X 12 Months
Sales
Let Debtors Be X
X
2 = ----------- X 12
3,00,000
X 1
------------- = ---
3,00,000 6
X = Rs.50,000
Debtors: Rs.50,000
It Is Assumed That All Sales Are Credit Sales.
3. Calculation Of Stock
Cost Of Goods Sold
Stock Turnover Ratio = --------------------------- = 6
= Average Stock
Cost Of Goods Sold = Sales – Gross Profit
= Rs.3,00,000 – Rs.60,000
= Rs.2,40,000
Rs.2,40,000
------------------ = 6
Average Stock
Rs.2,40,000
Average Stock = --------------- = Rs.40,000
6
Opening Stock + Closing Stock
Average Stock = --------------------------------------
2
Let Opening Stock Be Rs.X.
Then Closing Stock Will Be X + 5,000
X + X + 5,000
---------------- = 40,000
2
2X + 5,000
-------------- = 40,000
2
Cross Multiplying
2X + 5,000 = 80,000
2X = 80,000 – 5,000
= 75,000
X = 37,500
4. Calculation Of Creditors
Total Creditors
Creditors’ Velocity = ------------------------------ X 365
Days Credit Purchases
= 73 Days
Purchase = Cost Of Goods + Closing Stock – Opening Stock
= Rs.2,40,000 + 42,500 – 37,500
= Rs.2,45,000
Let The Creditors Be X
X
-------------- X 365 = 73
2,45,000
132
365 X = 2,45,000 X 73
2,45,000 X 73
X = ----------------
365
Creditors = Rs.49,000
5. Calculation Of Fixed Assets
Costs Of Goods Sold
Fixed Assets Turnover Ratio = ----------------------------- = 4
Fixed Assets
Let Fixed Assets Be X
2,40,000
---------- = 4
X
X = 60,000
Fixed Assets = Rs.60,000
6. Shareholders’ Fund
Cost Of Goods Sold
Capital Turnover Ratio = ----------------------- = 2
Proprietary Fund
2,40,000
--------------------- = 2
Proprietary Fund
Proprietary Fund = Rs.1,20,000
Shareholders’ Fund Includes Share Capital, Profit & Reserve.
Share Capital = Shareholders’ Fund – (Profit + Reserve)
= Rs.1,20,000 – Rs.80,000
= Rs.40,000
7. Calculation Of Bank Balance
Shareholders’ Fund + Current Liabilities = Fixed Assets + Current Assets
Rs.1,20,000 + 49,000 = Rs.60,000 + Current Assets
Current Assets = Rs.1,09,000
Current Assets = Stock + Debtors + Bank
Bank Balance = Current Assets – (Stock +
Debtors)
= Rs.1,09,000– (42,500 + 50,000)
= Rs.1,09,000 – 92,500
= Rs.16,500
Balance Sheet As On …
---------------------------------------------------------------------------------
Liabilities Rs. Assets Rs.
---------------------------------------------------------------------------------
Share Capital 40,000 Fixed Assets 60,000
Reserves & Surplus 20,000 Current Assets:
Profit 60,000 Stock 42,500
Current Liabilities 49,000 Debtors 50,000
Bank 16,500 ---------- ------------
1,69,000 1,69,000
---------------------------------------------------------------------------------
Illustration 6:
The Following Data Is Furnished:
A) Working Capital Rs.45,000
B) Current Ratio 2.5
C) Liquidity Ratio 1.5
D) Proprietary Ratio – (Fixed Assets To Proprietary Funds) 0.75
E) Overdraft Rs.10,000
F) Retained Earnings Rs.30,000
There Are No Long Term Loans And Fictitious Assets.
Find Out:
1) Current Assets
2) Current Liabilities
3) Fixed Assets
4) Quick Assets
5) Quick Liabilities
6) Stock
7) Equity
Solution:
Current Assets
Current Assets 2.5
Current Liability 1.0
---
Working Capital 1.5
If Working Capital Is 1.5, Current Asset Will Be 2.5.
If Working Capital Is Rs.45,000, Current Assets Will Be Rs.75,000
Current Assets = Rs.75,000
Current Liability
Current Liability = Current Assets – Working Capital
= Rs.75,000 – Rs.45,000
= Rs.30,000
Fixed Assets
Shareholders’ Fund+ Current Liabilities = Fixed Assets + Current Assets
Shareholders’ Fund=Fixed Assets + Current Assets – Current Liabilities
= Fix
ed Assets + Rs.75,000 – Rs.30,000
= Fix
ed Assets + Rs.45,000
Let The Shareholders’ Fund Be X, Fixed Assets Will Be ¾ X
X = Rs. ¾ X + Rs.45,000
¼ X = Rs.45,000
X = Rs.1,80,000
¾ X = Rs.1,35,000
Fixed Assets = Rs.1,35,000
Shareholders Funds = Rs.1,35,000 + Rs.45,000
= Rs.1,80,000
Stock
Quick Assets
Liquid Ratio = -------------------
Quick Liabilities
Quick Assets = Current Assets – Stock
Quick Liabilities = Current Liabilities – Bank Overdraft
Let The Value Of Stock Be X.
Quick Assets Rs.75,000 – X
-------------------- = ---------------------
Quick Liabilities 30,000 – 10,000
75,000 - X
= ------------- = 1.5
20,000
Cross Multiplying
75,000 – X = 20,000 X 1.5
75,000 – X = 30,000
X
= 45,000
Stock = Rs.45,000
Quick Assets = Rs.75,000 – Rs.45,000
= Rs.30,000
Quick Liabilities = Rs.20,000
Equity
Shareholders’ Fund = Equity + Retained Earnings
Shareholders’ Fund = Rs.1,80,000 (As Calculated)
Retained Earnings = Rs.30,000 (As Given)
Equity = Rs.1,50,000
Illustration 7:
From the following balance sheet of dinesh limited calculate (i) current ratio (ii) liquid ratio (iii) debt-equity ratio (iv) proprietary ratio, and (v) capital gearing ratio.
Balance Sheet Of Dinesh Limited As On 31-12-2005
---------------------------------------------------------------------------------
Liabilities Rs. Assets Rs.
---------------------------------------------------------------------------------
Equity share capital 10,00,000 goodwill 5,00,000
6% preference capita l 5,00,000 plant & machinery 6,00,000
Reserves 1,00,000 land & buildings 7,00,000
Profit & loss a/c 4,00,000 furniture 1,00,000
Tax provision 1,76,000 stock 6,00,000
Bills payable 1,24,000 bills receivables 30,000
Bank overdraft 20,000 sundry debtors 1,50,000
Sundry creditors 80,000 bank account 2,00,000
12% debentures 5,00,000 short term investment 20,000
------------ ---------
29,00,000 29,00,000
---------------------------------------------------------------------------------
Current Assets
(I) Current = ------------------------
Ratio Current Liabilities
Stock + Bills Receivables + Debtors + Bank + S.T. Investments
= ----------------------------------------------------------------
S.Creditors + Bills Payable + Bank O.D. + Tax Provision
10,00,000
= ------------ = 2.5 : 1.
4,00,000
Interpretation:
The current ratio in the said firm is 2.5:1 against a standard ratio of 2:1. It is a good sign of liquidity. However, the stock is found occupying 60 percent of current assets which may not be easily realisable.
Current Assets – Stocks
(II) Liquid Ratio = --------------------------------
Current Liabilities
Liquid Assets
= ------------------------
Current Liabilities
4,00,000
= ----------
4,00,000
= 1:1.
Interpretation:
The standard for quick ratio is 1:1. The calculated ratio in case of dinesh limited is also 1:1. The above two ratios show the safety in respect of liquidity in the said firm.
Long Term Debt
(III) Debt Equity Ratio = -------------------------------------
Equity Shareholders’ Fund
Debentures
= ---------------------------------------------------------------------------
Equity Capital + Preference Capital + Reserves + Profit & Loss A/C
5,00,000
= -------------------------------------------------------
10,00,000 + 5,00,000 + 1,00,000 + 4,00,000
= 1:4.
Interpretation:
Debt-equity ratio indicates the firm’s long term solvency. It can be observed that the firm’s long term loans are constituting 25 percent to that of the owners’ fund. Although such a low ratio indicates better long term solvency, the less use of debt in capital structure may not enable the firm to gain from the full stream of leverage effects.
Proprietors’ Funds
(IV) Proprietary Ratio = ---------------------------
Total Assets
20,00,000
= ------------ = 20:29
29,00,000
Interpretation:
Out of total assets, seven-tenths are found financed by owners’ funds. In other words a large majority of long term funds are well invested in various long term assets in the firm.
Owners’ Resources
(V) Capital Gearing Ratio = -------------------------------------------
Fixed-Interest Bearing Resources
Equity Share Capital + Reserves + P&L A/C
= -----------------------------------------------
Preference Capital + Debentures
10,00,000 + 1,00,000 + 4,00,000
= --------------------------------------------
5,00,000 + 5,00,000
15,00,000
= --------------- = 1.5:1.
10,00,000
Interpretation:
Keeping rs.15 lakhs of equity funds as security, the firm is found to have mobilised rs.10 lakhs from fixed interest bearing sources. It indicates that the capital structure is low geared.
Illustration 8:
The following are the balance sheet and profit and loss account of sundara products limited as on 31st december 2005.
Profit And Loss Account
To Opening Stock 1,00,000 By Sales 8,50,000
Purchases 5,50,000 Closing Stock 1,50,000
Direct Expenses 15,000
Gross Profit 3,35,000
------------ ------------
10,00,000 10,00,000
------------ ------------
To Admn. Expenses 50,000 By Gross Profit 3,35,000
Office Establishment 1,50,000 Non-Operating
Income 15,000
Financial Expenses 50,000
Non-Operating
Expenses/Losses 50,000
Net Profit 50,000
-----------
-----------
3,50,000 3,50,000
---------------------------------------------------------------------------------
Balance Sheet
Liabilities Rs. Assets Rs.
Equity Share Capital Land & Buildings 1,50,000
(2000 @ 100) 2,00,000 Plant & Machinery 1,00,000
Reserves 1,50,000 Stock In Trade 1,50,000
Current Liabilities 1,50,000 Sundry Debtors 1,00,000
P&L A/C Balance 50,000 Cash & Bank 50,000
----------
----------
5,50,000 5,50,000
---------------------------------------------------------------------------------
Calculate Turnover Ratios.
Solution:
(I) Share Capital To Turnover Ratio
Sales
= ----------------------------------
Total Capital Employed
Sales
= ------------------------------------------------
Equity + Reserve + P & L A/C Balance
8,50,000
= ----------
4,00,000
= 2.13 Times.
Interpretation:
This turnover ratio indicates that the firm has actually converted its share capital into sales for about 2.13 times. This ratio indicates the efficiency in use of capital resources and a high turnover ratio ensures good profitability on operations on an enterprise.
(ii) fixed asset’s turnover ratio
Sales
= ---------------------------
Total fixed assets
Sales
= ------------------------------------
Land + Plant & Machinery
8,50,000
= ------------
2,50,000
= 3.4 times.
Interpretation:
Although fixed assets are not directly involved in the process of generating sales, these are said to back up the production process. A ratio of 3.4 times indicates the efficient utilisation of various fixed assets in this organisation.
(iii) Net working capital turnover:
Sales
= ----------------------------
Net Working Capital
Sales
= --------------------------------------------
Current Assets – Current Liabilities
8,50,000
= -----------------------
3,00,000 – 1,50,000
= 5.67 Times.
Interpretation:
Net working capital indicates the excess of current assets financed by permanent sources of capital. An efficient utilisation of such funds is of prime importance to ensure sufficient profitability along with greater liquidity. A turnover ratio of 5.7 times is really appreciable.
(iv) Average Collection Period:
Credit Sales
Debtor’s Turnover = -----------------------
Average Debtors
Assuming that 80% of the sales of 8,50,000 as credit sales:
6,80,000
= ------------
1,00,000
= 6.8 times
Average collection period
360 Days
= -------------------------
Debtors’ Turnover
360
= -------
6.8
= 53 Days
Interpretation:
Average collection period indicates the time taken by a firm in collecting its debts. The calculated ratio shows that the realisation of cash on credit sales is taking an average period of 53 days. A period of roughly two months indicate that the credit policy is liberal and needs a correction.
(v) Stock Turnover Ratio
Cost Of Goods Sold
= ---------------------------
Average Stock
Sales – Gross Profit
= ------------------------------------------------
(Opening Stock + Closing Stock) + 2
5,15,000
= ----------
1,25,000
= 4.12 times.
Interpretation:
Stock velocity indicates the firm’s efficiency and profitability. The stock turnover ratio shows that on an average inventory balances are cleared once in 3 months. Since there is no standard for this ratio, the period of operating cycle of this firm is to be compared with the industry average for better interpretation.
Illustration 9:
Comment on the performance of arasu limited from the ratios given below:
Industry average Ratios of
Ratios Arasu ltd.
1. Current ratio 2:1 2.5:1
2. Debt-equity ratio 2:1 1:1
3. Stock turnover ratio 9.5 3.5
4. Net profit margin ratio 23.5% 15.1%
Solution:
(i) Current Ratio:
This ratio indicates the liquidity position of a firm. The ability of a firm in meeting its current liabilities could be understood by this ratio. The calculated results show that the liquidity in arasu limited is even greater than industry average, showing the safety. However, excess liquidity locks up the capital in unnecessary current assets.
(ii) Debt-Equity Ratio:
It is an indicator of a firm’s solvency in terms of its ability to repay long term loans in time. The calculated ratio shows better solvency of 1:1 indicating that for every one rupee of debt capital, to repay one rupee of equity base exists in arasu ltd. However, this ratio is not likely to ensure the leverage benefits that a firm gains by using higher dose of debt.
(iii) Stock Turnover Ratio:
Stock velocity is an indicator of a firm’s activeness. It directly influences the profitability of a firm. The calculated ratio for arasu ltd. Is very poor when compared to industry average. This poor ratio indicates the inefficient use of capacities, consequently, the likely low profitability.
(iv) Net Profit Margin Ratio:
Although the firms in a particular industry could sell the product more or less at same price, the net profits differ among firms due to their cost of production, excessive administrative and establishment expenses etc. This picture is found true in case of arasu ltd. A poor profitability of 15.1% compared to an industry average of 23.5% may be due to low stock turnover, inefficiency in management, excess overhead cost and excessive interest burdens.
Tags : Accounting For Managers - Ratio Analysis
Last 30 days 4288 views