


Managerial Economics - Cost Analysis
Determinants Of Short –Run Cost - Cost Analysis
Posted On :
Some inputs are used over a period of time for producing more than one batch of goods.
Determinants Of Short –Run Cost
Fixed cost: Some inputs are used over a period of time for producing more than one batch of goods. The costs incurred in these are called fixed cost. For example amount spent on purchase of equipment, machinery, land and building.
Variable cost: When output has increased the firm spends more on these items. For example the money spent on labour wages, raw material and electricity usage. Variable costs vary according to the output. In the long run all costs become variable.
Total cost: The market value of all resources used to produce a good or service.
Total Fixed cost: Cost of production remains constant whatever the level of output.
Total Variable cost: Cost of production varies with output.
Average cost: Total cost divided by the level of output.
Average variable cost: Variable cost divided by the level of output.
Average fixed cost: Total fixed cost divided by the level of output.
Marginal cost: Cost of producing an extra unit of output.
Fixed cost curve is a horizontal line which is parallel to the ‘X’ axis. This cost is constant with respect to output in the short run. Fixed cost does not change with output. It must be paid even if ‘0’ units of output are produced. For example: if you have purchased a building for the business you have invested capital on building even if there is no production.
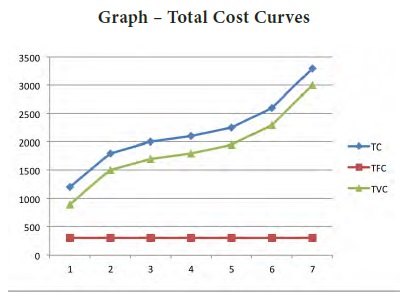
Total fixed cost (TFC) consists of various costs incurred on the building, machinery, land, etc.. For example if you have spent Rs. 2 Lakhs and bought machinery and building which is used to produce more than one batch of commodity, then the same cost of Rs. 2 Lakhs is fixed cost for all batches. The total variable costs vary according to the output. Whenever the output increases the firm has to buy more raw materials, use more electricity, labour and other sources therefore the TVC curve is upward sloping. The total cost consists of fixed (TFC) and variable costs (TVC). The TFC of Rs. 2 Lakhs is included with the variable cost throughout the production schedule so the total cost (TC) is above the TVC line.
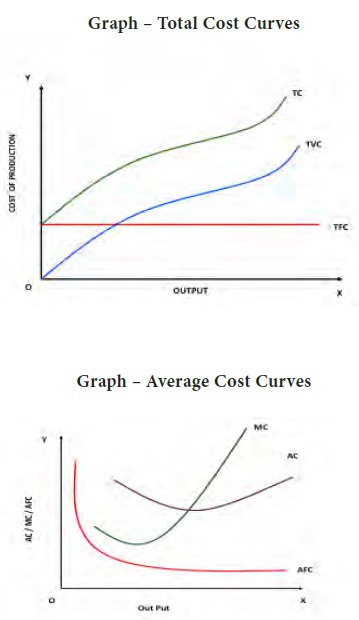
The above set of graphs indicates clearly that the average variable cost curve looks like a boat. Average fixed cost curve declines as output increases and it is a hyperbola to the origin. The Marginal cost curve slopes like a tick mark which declines up to an extent then it starts increasing
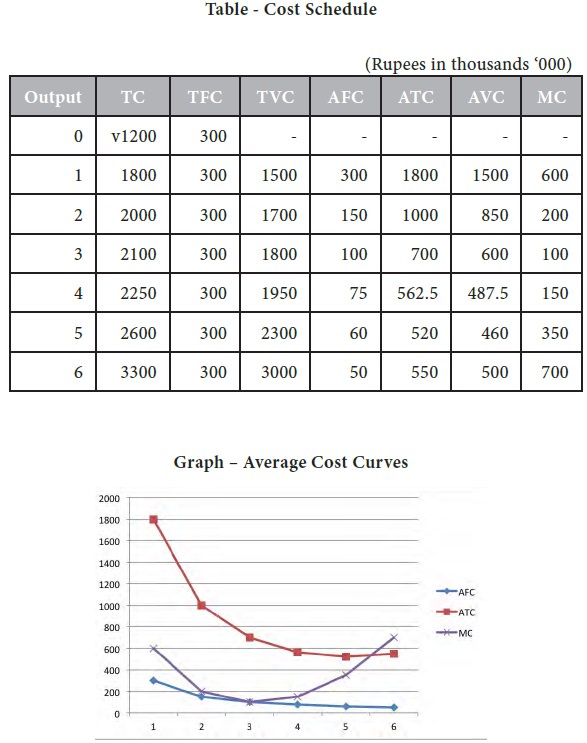
From the above table and set of graphs we can understand that capital is the fixed factor of production and the total fixed cost will be the same Rs. 300,000. The total variable cost will increase as more and more goods are produced. So the total variable cost TVC of producing 1 unit is Rs.1500 000, for 2 units 1700 000 and so on.
Total cost = TFC + TVC for 1 unit TC = 300 + 1500 = 1800.
The marginal cost of producing an extra unit is calculated based on the difference in total cost.
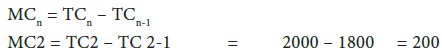
MC for 5th unit = TC of 5th unit minus TC of 4th unit, in our example 2600 – 2250 = 350.
Fixed cost: Some inputs are used over a period of time for producing more than one batch of goods. The costs incurred in these are called fixed cost. For example amount spent on purchase of equipment, machinery, land and building.
Variable cost: When output has increased the firm spends more on these items. For example the money spent on labour wages, raw material and electricity usage. Variable costs vary according to the output. In the long run all costs become variable.
Total cost: The market value of all resources used to produce a good or service.
Total Fixed cost: Cost of production remains constant whatever the level of output.
Total Variable cost: Cost of production varies with output.
Average cost: Total cost divided by the level of output.
Average variable cost: Variable cost divided by the level of output.
Average fixed cost: Total fixed cost divided by the level of output.
Marginal cost: Cost of producing an extra unit of output.
Short Run Cost Output Relationship
Fixed cost curve is a horizontal line which is parallel to the ‘X’ axis. This cost is constant with respect to output in the short run. Fixed cost does not change with output. It must be paid even if ‘0’ units of output are produced. For example: if you have purchased a building for the business you have invested capital on building even if there is no production.
Total fixed cost (TFC) consists of various costs incurred on the building, machinery, land, etc.. For example if you have spent Rs. 2 Lakhs and bought machinery and building which is used to produce more than one batch of commodity, then the same cost of Rs. 2 Lakhs is fixed cost for all batches. The total variable costs vary according to the output. Whenever the output increases the firm has to buy more raw materials, use more electricity, labour and other sources therefore the TVC curve is upward sloping. The total cost consists of fixed (TFC) and variable costs (TVC). The TFC of Rs. 2 Lakhs is included with the variable cost throughout the production schedule so the total cost (TC) is above the TVC line.
The above set of graphs indicates clearly that the average variable cost curve looks like a boat. Average fixed cost curve declines as output increases and it is a hyperbola to the origin. The Marginal cost curve slopes like a tick mark which declines up to an extent then it starts increasing
From the above table and set of graphs we can understand that capital is the fixed factor of production and the total fixed cost will be the same Rs. 300,000. The total variable cost will increase as more and more goods are produced. So the total variable cost TVC of producing 1 unit is Rs.1500 000, for 2 units 1700 000 and so on.
Total cost = TFC + TVC for 1 unit TC = 300 + 1500 = 1800.
The marginal cost of producing an extra unit is calculated based on the difference in total cost.
MC for 5th unit = TC of 5th unit minus TC of 4th unit, in our example 2600 – 2250 = 350.
AVC also is calculated in the same manner TVC / output = 2600 / 5 = 460
AFC = TFC / output = 300 / 5 = 60.
Tags : Managerial Economics - Cost Analysis
Last 30 days 2660 views