


Managerial Economics - Cost Analysis
Cost Output Relationship In The Long Run - Cost Analysis
Posted On :
In the long run costs fall as output increases due to economies of scale, consequently the average cost AC of production falls.
Cost
Output Relationship In The Long Run
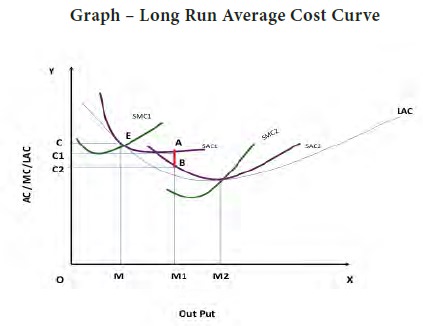
In the long run costs fall as output increases due to economies of scale, consequently the average cost AC of production falls. Some firms experience diseconomies of scale if the average cost begins to increase. This fall and rise derives a U shaped or boat shaped average cost curve in the long run which is denoted as LAC. The minimum point of the curve is said to be the optimum output in the long run. It is explained graphically in the chart given below.
In the long run costs fall as output increases due to economies of scale, consequently the average cost AC of production falls. Some firms experience diseconomies of scale if the average cost begins to increase. This fall and rise derives a U shaped or boat shaped average cost curve in the long run which is denoted as LAC. The minimum point of the curve is said to be the optimum output in the long run. It is explained graphically in the chart given below.
In the long run all factors are
variable and the average cost may fall or increase to A, B respectively but all
these costs are above the long run cost average cost. LAC is the lower envelope
of all the short run average cost curves because it contains them all. At point
‘E’ the SAC1 and SMC1 intersects each other, in case the organization increases
its output from OM to OM1 they have to spend OC1 amount. In case the
organization purchases one more machine (increase in fixed cost) then they will
get a new set of cost curves SAC2, and SMC2. But the new average cost curve
reduces the cost of production from OC1 to OC2.That means they can save the
difference of C1C2 which is nothing but AB. Therefore in the long run due to
business expansion a firm can reduce their cost of production. During their
business life they will meet many combinations of optimum production and
minimum cost in different short periods. In the long run due to law of
diminishing returns the long run average cost curve LAC also slopes like boat
shape.
Tags : Managerial Economics - Cost Analysis
Last 30 days 11167 views