


Managerial Economics - Cost Analysis
Optimum Output And Minimum Cost - Cost Analysis
Posted On :
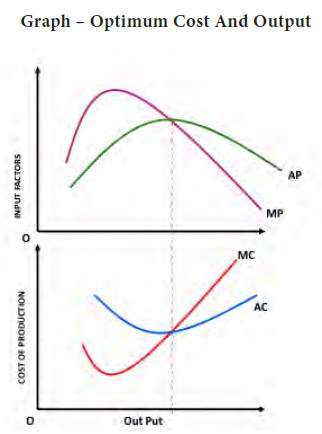
The MC and AC curves are mirror image of the MP and AP curves. It is presented in the graph below.
Optimum Output And Minimum
Cost
The MC and AC curves are mirror image of the MP and AP curves. It is presented in the graph below.
All organizations aim for maximum output with minimum cost. To achieve this goal they like to derive the point where optimum output can be produced with the given amount of input factors and with a minimum average cost. In the graph the MP=AP at maximum average production. On the other hand MC = AC at minimum average variable cost. Therefore this is the optimum output to be produced to achieve their managerial goals.
The above set of cost curves explain the cost output relationship in the short period but in the long run there is no fixed cost because all costs vary over a period of time. Therefore in the long run the firm will have only average cost curve that is called as long run average cost curve (LAC). Let us see how the average cost curve is derived in the long run. This LAC also slopes like the short period average cost curve (U shaped) provided the law of diminishing returns prevails. In case the returns to scale are increasing or constant then the LAC curve will have a different slope. It will be a horizontal line, which is parallel to the ‘X’ axis.
Tags : Managerial Economics - Cost Analysis
Last 30 days 2081 views