


Research Methodology - Analysis Of Variance
ANOVA table for one-way classified data - Analysis Of Variance
Posted On :
The variance ratio is the ratio of the greater variance to the smaller variance. It is also called the F-coefficient.
ANOVA table for one-way classified data
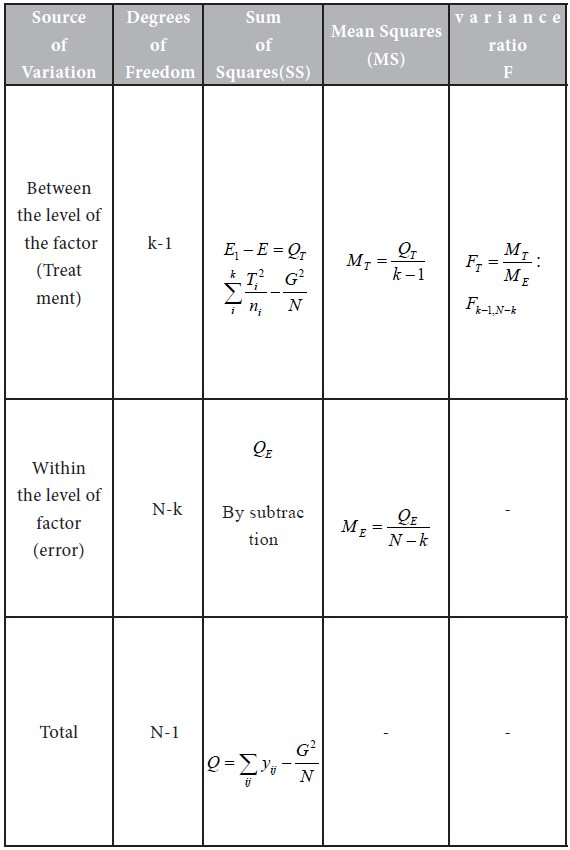
The variance ratio is the ratio of the greater variance to the smaller variance. It is also called the F-coefficient. We have
F = greater variance / smaller variance.
We refer to the table of F values at a desired level of significance α. In general, α is taken to be 5 %. The table value is referred to as the theoretical value or the expected value. The calculated value is referred to as the observed value.
If the observed value of F is less than the expected value of F (i.e., Fo < Fe) for the given level of significance α , then the null hypothesis Ho is accepted. In this case, we conclude that there is no significant difference between the treatment effects.
On the other hand, if the observed value of F is greater than the expected value of F (i.e., ) for the given level of significance α , then the null hypothesis Ho is rejected. In this case, we conclude that all the treatment effects are not equal.
Note:
If the calculated value of F and the table value of f are equal, we can try some other value of α .
Problem 1
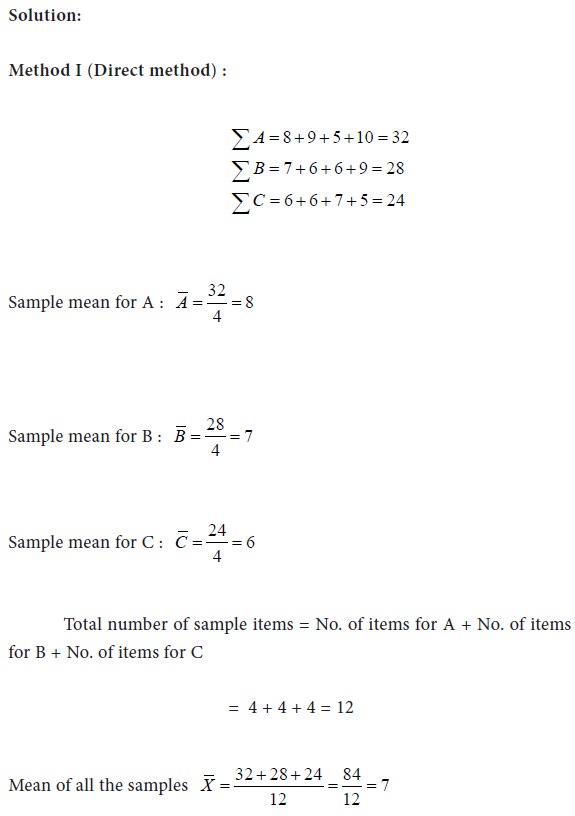
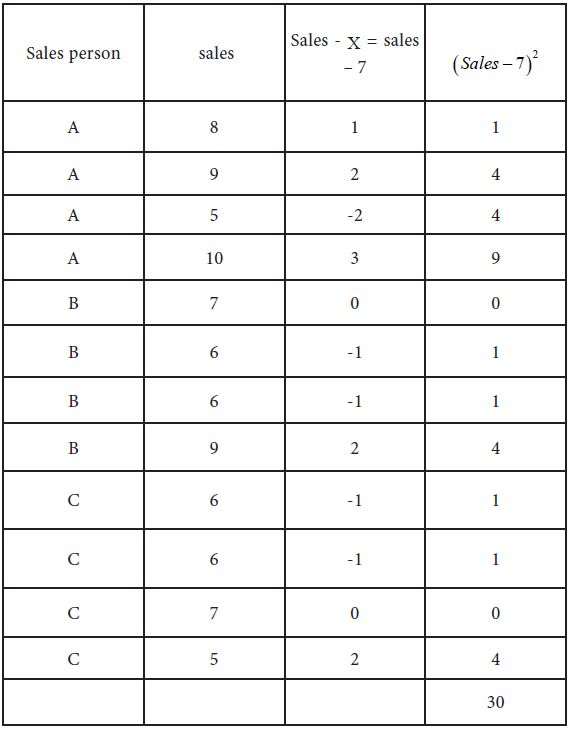
The following are the details of sales effected by three sales persons in three door-to-door campaigns.
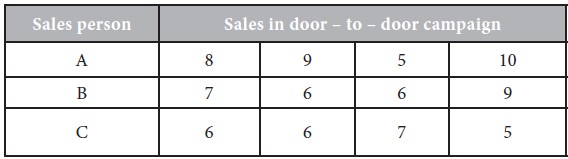
Construct an ANOVA table and find out whether there is any significant difference in the performance of the sales persons.
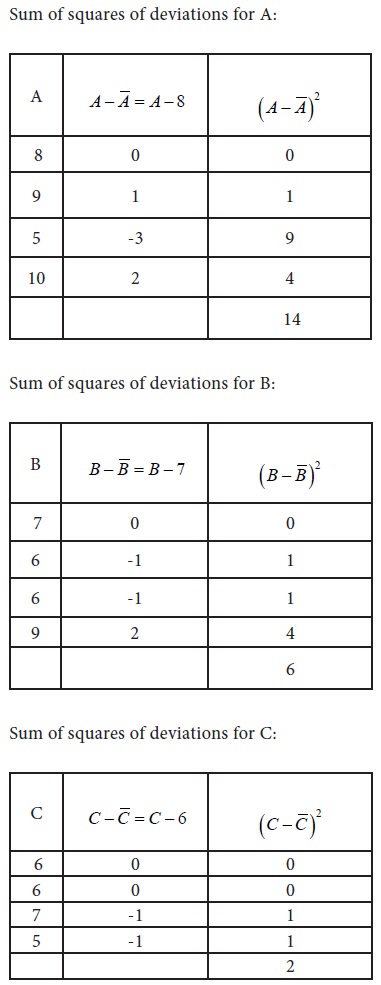
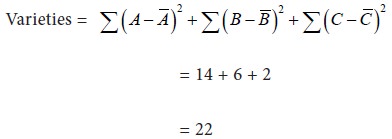
Sum of squares of deviations within
Variance ratio
The variance ratio is the ratio of the greater variance to the smaller variance. It is also called the F-coefficient. We have
F = greater variance / smaller variance.
We refer to the table of F values at a desired level of significance α. In general, α is taken to be 5 %. The table value is referred to as the theoretical value or the expected value. The calculated value is referred to as the observed value.
Inference
If the observed value of F is less than the expected value of F (i.e., Fo < Fe) for the given level of significance α , then the null hypothesis Ho is accepted. In this case, we conclude that there is no significant difference between the treatment effects.
On the other hand, if the observed value of F is greater than the expected value of F (i.e., ) for the given level of significance α , then the null hypothesis Ho is rejected. In this case, we conclude that all the treatment effects are not equal.
Note:
If the calculated value of F and the table value of f are equal, we can try some other value of α .
Problem 1
The following are the details of sales effected by three sales persons in three door-to-door campaigns.
Construct an ANOVA table and find out whether there is any significant difference in the performance of the sales persons.
Sum of squares of deviations within
Sum of squares of deviations for total variance:
Tags : Research Methodology - Analysis Of Variance
Last 30 days 4415 views