


Managerial Economics - Macro Economics
Economic Indicators - Macro Economics
Posted On :
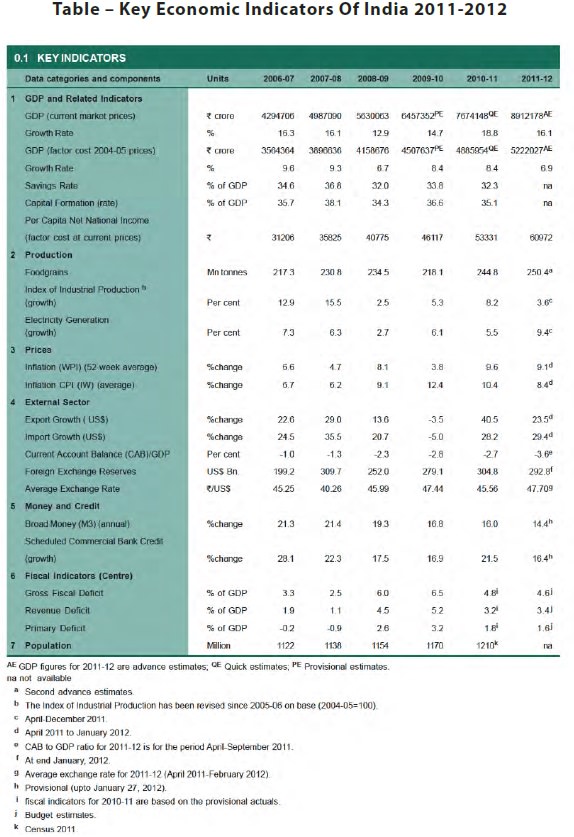
The Indian economy is estimated to grow at 6.9 per cent in 2011-12, after having grown at the rate of 8.4 per cent in each of the two preceding years.
Economic
Indicators
The Indian economy is estimated to grow at 6.9 per cent in 2011-12, after having grown at the rate of 8.4 per cent in each of the two preceding years. This indicates a slowdown when compared to the previous two years but even during the period 2003 to 2011. Inflation as measured by the wholesale price index (WPI) was higher during most of the current fiscal year, though by the year end there was a clear slowdown. Food inflation, in particular, has come down to around zero, with most of the remaining WPI inflation being driven by non-food manufacturing products. Monetary policy was tightened by the Reserve Bank of India (RBI) during the year to control inflation and curb inflationary pressures. The slowing inflation reflects the lagged impact of actions taken by the RBI and the government. Reflecting the weak manufacturing activity and rising costs, revenues of the centre have remained less than anticipated; and, with higher than-budgeted expenditure, a slippage is expected on the fiscal side.
The global economic environment, which has been tenuous at best throughout the year, turned adversely in September 2011 owing to the turmoil in the Euro zone, and questions about the outlook on the US economy provoked by rating agencies. However, for the Indian economy, the outlook for growth and price stability at this juncture looks more promising. There are signs from some high frequency indicators that the weakness in economic activity has slowed down and a gradual upswing is imminent. The key economic indicators of India for the year 2011-12 are given in the table below.

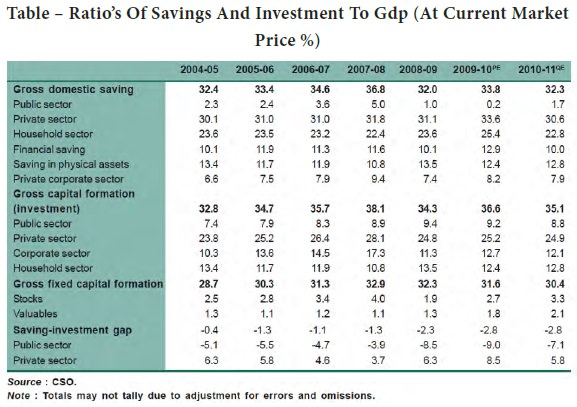
The major national savings and investments are shown in the above table. In the past five years public sector savings reduced and on other hand its investment has grown. Household’s saving and investment has come down.
The sectoral contribution of GDP shows that in the 1950s agricultural sector’s contribution was around 53% but now it has come down to 14% . After opening up our economy the service sectors contribution has grown tremendously and it has reached 60%. Industrial growth of our country is very slow with an increase from 16% in 1950 to 27% in 2012.
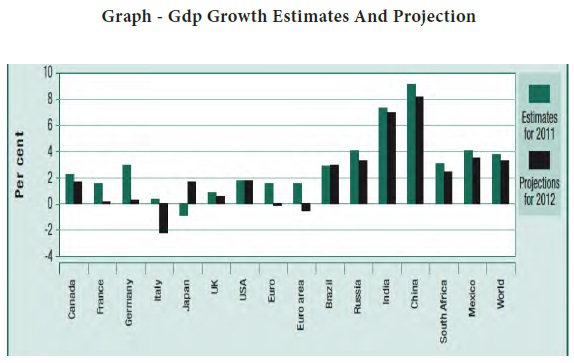
The GDP growth estimates of
various countries are given in the above graph. It is found that China’s growth
rate is nearly 10% followed by India with 7%. Italy and Euro areas have
negative growth. It indicates that Asian countries are growing at a faster rate
than the Western countries.
The Indian economy is estimated to grow at 6.9 per cent in 2011-12, after having grown at the rate of 8.4 per cent in each of the two preceding years. This indicates a slowdown when compared to the previous two years but even during the period 2003 to 2011. Inflation as measured by the wholesale price index (WPI) was higher during most of the current fiscal year, though by the year end there was a clear slowdown. Food inflation, in particular, has come down to around zero, with most of the remaining WPI inflation being driven by non-food manufacturing products. Monetary policy was tightened by the Reserve Bank of India (RBI) during the year to control inflation and curb inflationary pressures. The slowing inflation reflects the lagged impact of actions taken by the RBI and the government. Reflecting the weak manufacturing activity and rising costs, revenues of the centre have remained less than anticipated; and, with higher than-budgeted expenditure, a slippage is expected on the fiscal side.
The global economic environment, which has been tenuous at best throughout the year, turned adversely in September 2011 owing to the turmoil in the Euro zone, and questions about the outlook on the US economy provoked by rating agencies. However, for the Indian economy, the outlook for growth and price stability at this juncture looks more promising. There are signs from some high frequency indicators that the weakness in economic activity has slowed down and a gradual upswing is imminent. The key economic indicators of India for the year 2011-12 are given in the table below.
The major national savings and investments are shown in the above table. In the past five years public sector savings reduced and on other hand its investment has grown. Household’s saving and investment has come down.
The sectoral contribution of GDP shows that in the 1950s agricultural sector’s contribution was around 53% but now it has come down to 14% . After opening up our economy the service sectors contribution has grown tremendously and it has reached 60%. Industrial growth of our country is very slow with an increase from 16% in 1950 to 27% in 2012.
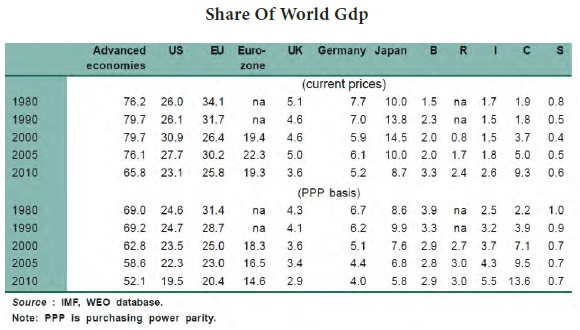
From the above table we can
understand that the share of advanced economies in the world GDP is declining.
It has reduced from 76% to 66%. whereas in the case of India, it has increased
from 1.7% to 2.6%. From this we can conclude that Indian economy is growing and
it is expressed in the various economic activities of our country. The major
economic indicators are growing at a faster rate. The service sector’s
contribution towards the economic development of our country is very high, due
to this change the employment opportunities created by this sector has also grown at a
faster rate. This is discussed in the following chapters.
Tags : Managerial Economics - Macro Economics
Last 30 days 664 views