


Managerial Economics - Production Analysis
ISO-Quants - Production Analysis
Posted On :
To understand the production function with two variable inputs, iso-quant curve is used.
ISO-Quants
To understand the production function with two variable inputs, iso-quant curve is used. These curves show the various combinations of two variable inputs resulting in the same level of output. The shape of an Iso-quant reflects the ease with which a producer can substitute among inputs while maintaining the same level of output. From the graph we can understand that the iso-quant curve indicates various combinations of capital and labour usage to produce 100 units of motor pumps. The points a, b or any point in the curve indicates the same quantum of production. If the production increases to 200 or 300 units definitely the input usage will also increase therefore the new iso-quant curve for 200 units (Q1) is shifted upwards. Various iso-quant curves presented in a graph is called as iso- quant map.
Iso-cost: different combination of inputs that can be purchased at a given expenditure level.
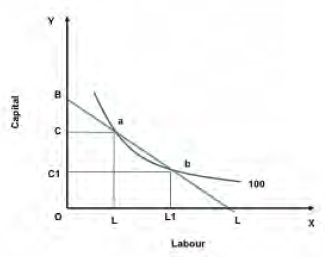
The above graph explains clearly that the iso quant curve for 100 units of motor consists of ‘n’ number of input combinations to produce the same quantity. For example at ‘a’ to produce 100 units of motors the firm uses OC amount of capital and OL amount of labour ie., more capital and less labour force. At ’b’ OC1 amount of capital and OL1 labour force is used to produce the same that means more labour and less capital.
Optimal input combination: The points of tangency between iso quant and iso cost curves depict optimal input combination at different activity levels.
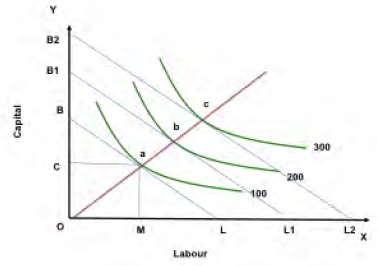
Expansion path: Optimal input combinations as the scale of production expand. From the graph it is clear that the optimum combination is selected based on the tangency point of iso cost (budget line) and iso- quant ie., a, b respectively. The point ‘a’ indicates that to produce 100 units of motor the best combination of capital and labour are OC and OM which is within the budget. Over a period of time a firm will face various optimum levels if we connect all points we derive expansion path of a firm.
To understand the production function with two variable inputs, iso-quant curve is used. These curves show the various combinations of two variable inputs resulting in the same level of output. The shape of an Iso-quant reflects the ease with which a producer can substitute among inputs while maintaining the same level of output. From the graph we can understand that the iso-quant curve indicates various combinations of capital and labour usage to produce 100 units of motor pumps. The points a, b or any point in the curve indicates the same quantum of production. If the production increases to 200 or 300 units definitely the input usage will also increase therefore the new iso-quant curve for 200 units (Q1) is shifted upwards. Various iso-quant curves presented in a graph is called as iso- quant map.
Iso-cost: different combination of inputs that can be purchased at a given expenditure level.
The above graph explains clearly that the iso quant curve for 100 units of motor consists of ‘n’ number of input combinations to produce the same quantity. For example at ‘a’ to produce 100 units of motors the firm uses OC amount of capital and OL amount of labour ie., more capital and less labour force. At ’b’ OC1 amount of capital and OL1 labour force is used to produce the same that means more labour and less capital.
Optimal input combination: The points of tangency between iso quant and iso cost curves depict optimal input combination at different activity levels.
Expansion path: Optimal input combinations as the scale of production expand. From the graph it is clear that the optimum combination is selected based on the tangency point of iso cost (budget line) and iso- quant ie., a, b respectively. The point ‘a’ indicates that to produce 100 units of motor the best combination of capital and labour are OC and OM which is within the budget. Over a period of time a firm will face various optimum levels if we connect all points we derive expansion path of a firm.
Tags : Managerial Economics - Production Analysis
Last 30 days 1053 views