


Managerial Economics - Demand Analysis
Demand Curve - Demand Analysis
Posted On :
A curve indicating the total quantity of a product that all consumers are willing and able to purchase at the prevailing price level, holding the prices of related goods, income and other variables as constant.
Demand Curve
A curve indicating the total quantity of a product that all consumers are willing and able to purchase at the prevailing price level, holding the prices of related goods, income and other variables as constant.
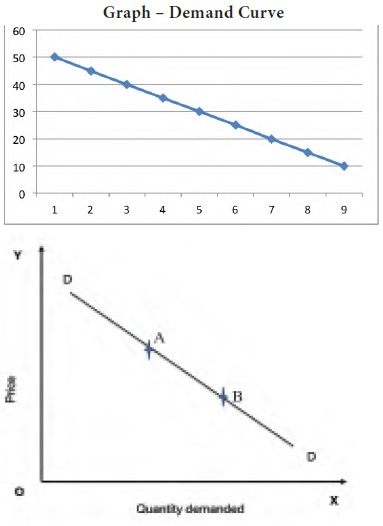
A demand curve is a graphical representation of a demand schedule. The price is quoted in the ‘Y’ axis and the quantity demanded over time at different price levels is quoted in ‘X’ axis. Each point on the curve refers to a specific quantity that will be demanded at a given price. If for example the price of a 200 ml coke is Rs. 10, this curve tells us that the consumer (the students in a class of 50) would purchase 20 units. When the price rises to Rs. 50 there was only one student would buy it. The demand curve, (DD) is downward sloping curve from left to right showing that as price falls, quantity demanded rises. This inverse relationship between price and quantity is called as the law of demand. When price changes, there is said to be a movement along the curve from point A to B.
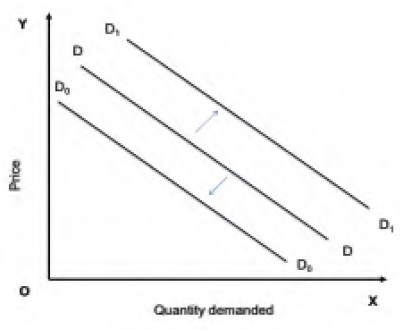
Shift of the demand curve occurs when the determinants of demand change. When tastes and preferences and incomes are altered, the basic relationship between price and quantity demanded changes (shifts). This shifts the entire demand curve upward (rightward) and is called as increase in demand because more of that commodity is demanded at that price. The downward shift (leftward) is called as decrease in demand. The new demand curves D1D1 and D0D0 can be seen in the Graph below.
Therefore we understand that a shift in a demand curve may happen due to the changes in the variables other than price. The movement along a demand curve takes place (extension or contraction) due to price rise or fall.
When with a fall in price, more of a commodity is bought , then there is an extension of the demand curve. When lesser quantity is demanded with a rise in price, there is a contraction of demand.
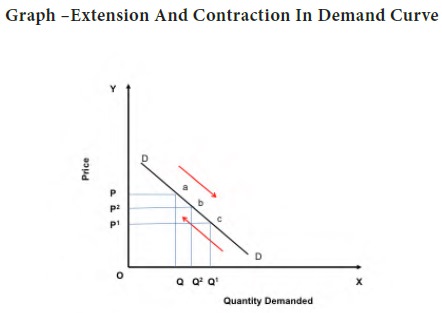
From the above graph we can understand that an increase in prices result in the contraction of demand. If the price increases from P2 to P then the demand for the commodity fall from OQ2 to OQ. Therefore the demand curve DD contracts from ‘b’ to ‘a’ on the other hand when there is a fall in price, it results in the extension of demand. Let us assume that the price falls from P2 to P1 then the quantity demanded OQ2 increases to OQ1 and the demand curve extends from point ‘b’ to ‘c’
Demand function is a function that describe how much of a commodity will be purchased at the prevailing prices of that commodity and related commodities, alternative income levels, and alternative values of other variables affecting demand.
Price is not the only factor which determines the level of demand for a good. Other important factor is income. The rise in income will lead to an increase in demand for a normal commodity. A few goods are named as inferior goods for which the demand will fall, when income rises. Another important factor which influences the demand for a good is the price of other goods. Other factors which affect the demand for a good apart from the above mentioned factors are:
Changes in Population
Changes in Fashion
Changes in Taste
Changes in Advertising
A change in demand occurs when one or more of the determinants of demand change and it is expressed in the following equation.
A curve indicating the total quantity of a product that all consumers are willing and able to purchase at the prevailing price level, holding the prices of related goods, income and other variables as constant.
A demand curve is a graphical representation of a demand schedule. The price is quoted in the ‘Y’ axis and the quantity demanded over time at different price levels is quoted in ‘X’ axis. Each point on the curve refers to a specific quantity that will be demanded at a given price. If for example the price of a 200 ml coke is Rs. 10, this curve tells us that the consumer (the students in a class of 50) would purchase 20 units. When the price rises to Rs. 50 there was only one student would buy it. The demand curve, (DD) is downward sloping curve from left to right showing that as price falls, quantity demanded rises. This inverse relationship between price and quantity is called as the law of demand. When price changes, there is said to be a movement along the curve from point A to B.
Shifts in Demand:
Shift of the demand curve occurs when the determinants of demand change. When tastes and preferences and incomes are altered, the basic relationship between price and quantity demanded changes (shifts). This shifts the entire demand curve upward (rightward) and is called as increase in demand because more of that commodity is demanded at that price. The downward shift (leftward) is called as decrease in demand. The new demand curves D1D1 and D0D0 can be seen in the Graph below.
Therefore we understand that a shift in a demand curve may happen due to the changes in the variables other than price. The movement along a demand curve takes place (extension or contraction) due to price rise or fall.
Extension And Contraction Of Demand Curve:
When with a fall in price, more of a commodity is bought , then there is an extension of the demand curve. When lesser quantity is demanded with a rise in price, there is a contraction of demand.
From the above graph we can understand that an increase in prices result in the contraction of demand. If the price increases from P2 to P then the demand for the commodity fall from OQ2 to OQ. Therefore the demand curve DD contracts from ‘b’ to ‘a’ on the other hand when there is a fall in price, it results in the extension of demand. Let us assume that the price falls from P2 to P1 then the quantity demanded OQ2 increases to OQ1 and the demand curve extends from point ‘b’ to ‘c’
Demand function is a function that describe how much of a commodity will be purchased at the prevailing prices of that commodity and related commodities, alternative income levels, and alternative values of other variables affecting demand.
Price is not the only factor which determines the level of demand for a good. Other important factor is income. The rise in income will lead to an increase in demand for a normal commodity. A few goods are named as inferior goods for which the demand will fall, when income rises. Another important factor which influences the demand for a good is the price of other goods. Other factors which affect the demand for a good apart from the above mentioned factors are:
Changes in Population
Changes in Fashion
Changes in Taste
Changes in Advertising
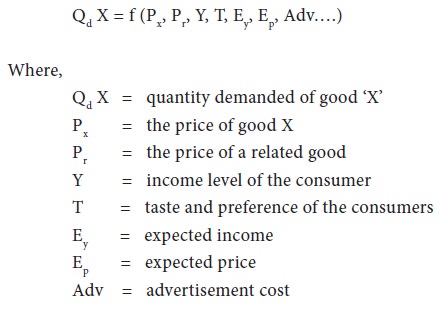
A change in demand occurs when one or more of the determinants of demand change and it is expressed in the following equation.
The above mentioned demand function expresses the relationship between the demand and other factors. The quantity demanded of commodity X varies according to the price of commodity (Px), income (Y), the price of a related commodity (Pr), taste and preference of the consumers (T), expected income (Ey) and advertisement cost(Adv) spent by the organization.
Tags : Managerial Economics - Demand Analysis
Last 30 days 1591 views